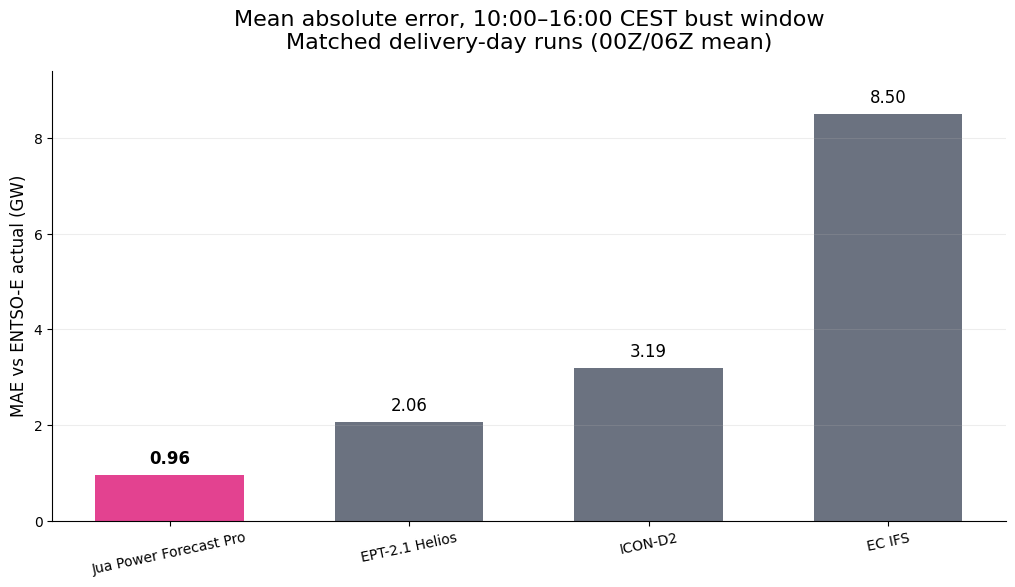
Jua Power Forecast Pro ranked first during Germany's solar forecast failure on 28 August 2026. Across matched delivery-day 00Z and 06Z runs, it recorded 0.96 GW mean absolute error through the six-hour bust window. That was 53% lower than EPT-2.1 Helios, 70% lower than ICON-D2, and 89% lower than EC IFS.
At 11:45–12:00 CEST, Jua's 06Z forecast was 0.69 GW above actual generation. EC IFS was 8.07 GW above actual generation for the same run and quarter-hour. The imbalance price settled at €3,730.38/MWh.
Key takeaways
- Across matched delivery-day runs, Jua Power Forecast Pro had the lowest error at 0.96 GW MAE, versus 2.06 GW for Helios, 3.19 GW for ICON-D2, and 8.50 GW for EC IFS.
- In the critical quarter-hour, Jua's 06Z error was 0.69 GW, compared with 0.73 GW for Helios, 4.89 GW for ICON-D2, and 8.07 GW for EC IFS.
- German solar peaked at 22.39 GW, 12.62 GW below the 35.01 GW EC IFS day-ahead call.
- The decisive 11:45–12:00 CEST quarter-hour settled at €3,730.38/MWh, the highest imbalance price of the day.
- At 06Z, Jua's forecast implied 0.8 GWh of shortfall across daylight hours, compared with 61.1 GWh for EC IFS.
What actually happened
Realised German solar generation peaked at 22.39 GW at 13:15 CEST and delivered 187.1 GWh across the day. That is the ground truth against which every forecast is scored here.
Output climbed normally to 20.83 GW by 11:15 CEST, then flattened and fell back to 19.95 GW at 11:45–12:00 CEST before recovering to its peak two hours later. The curve stopped climbing during the steepest part of a typical solar day.
The ENTSO-E day-ahead solar forecast expected 225.8 GWh for the day. Its intraday revision reduced that to 209.3 GWh, but actual generation was only 187.1 GWh. The TSO was therefore 38.7 GWh long day-ahead and still 22.2 GWh long after its intraday update.
The like-for-like 06Z comparison
At 11:45–12:00 CEST, realised German solar was 19.95 GW. The delivery-day 06Z forecasts provide a like-for-like comparison roughly four hours before delivery:
| Forecast | 06Z forecast (GW) | Error (GW) |
|---|---|---|
| Jua Power Forecast Pro | 20.64 | +0.69 |
| EPT-2.1 Helios | 20.68 | +0.73 |
| ICON-D2 | 24.84 | +4.89 |
| EC IFS | 28.01 | +8.07 |
Jua Power Forecast Pro and EPT-2.1 Helios had converged, with errors below 0.75 GW. ICON-D2 remained 4.89 GW long and EC IFS remained 8.07 GW long in the same quarter-hour.
The event was resolvable on the delivery-day morning by models using recent observations. The coarser global deterministic run did not resolve it.
Error across the full bust window
The mean of each model's 00Z and 06Z delivery-day runs gives a matched comparison across the full 10:00–16:00 CEST window:
- Jua Power Forecast Pro: 0.96 GW
- EPT-2.1 Helios: 2.06 GW
- ICON-D2: 3.19 GW
- EC IFS: 8.50 GW
The direction of the remaining error also differed. By the 06Z runs, Jua Power Forecast Pro had a -0.75 GW bias through the bust window and EPT-2.1 Helios -0.17 GW. Both had crossed to slightly short, meaning a trader following them would have been buying back a small amount rather than selling a large surplus. ICON-D2 was still +2.64 GW long and EC IFS +7.98 GW long.
EC IFS's 06Z run still carried a 32.99 GW peak, 10.6 GW above outturn, roughly four hours before the event. ICON-D2 improved the level to a 25.15 GW peak but held that peak too late. Jua Power Forecast Pro peaked at 21.69 GW, marginally short of the 22.39 GW outturn, while EPT-2.1 Helios peaked at 23.59 GW with near-zero bust-window bias.
Why the models diverged: cloud, not irradiance bookkeeping
Low and mid-level cloud drove the forecast differences. In the 06Z runs, averaged over 08:00–14:00 UTC and weighted by installed solar capacity, ICON-D2 carried a 0.348 low-cloud fraction and 0.773 medium-cloud fraction. EC IFS carried only 0.089 and 0.489 respectively.
ICON-D2's 06Z forecast therefore carried nearly four times as much low cloud and 58% more medium cloud than EC IFS over the German PV fleet.
ICON-D2 did not convert that cloud field into the correct generation profile. Its 06Z power forecast was still 4.89 GW long in the critical quarter-hour and carried a +2.64 GW average bias through the bust window.
The 06Z irradiance forecasts showed the same difference. Daylight-total, capacity-weighted global horizontal irradiance was 3.44 kWh/m² in EC IFS, 2.59 kWh/m² in ICON-D2, and 2.31 kWh/m² in EPT-2.1 Helios. EC IFS remained the sunniest forecast in the matched comparison.
Price impact: auctions repriced, then balancing punished
The day-ahead auction cleared the solar window cheaply because the market was long solar. Across 08:00–14:00 UTC, the day-ahead average was €114.12/MWh, with a trough at €92.07/MWh for 11:45–12:00 UTC.
Every subsequent auction repriced that window upward as the shortfall became visible:
- IDA1 averaged €123.37/MWh, €9.24 above day-ahead
- IDA2 averaged €132.88/MWh, €18.76 above day-ahead
- IDA3 averaged €139.10/MWh, €32.72 above day-ahead
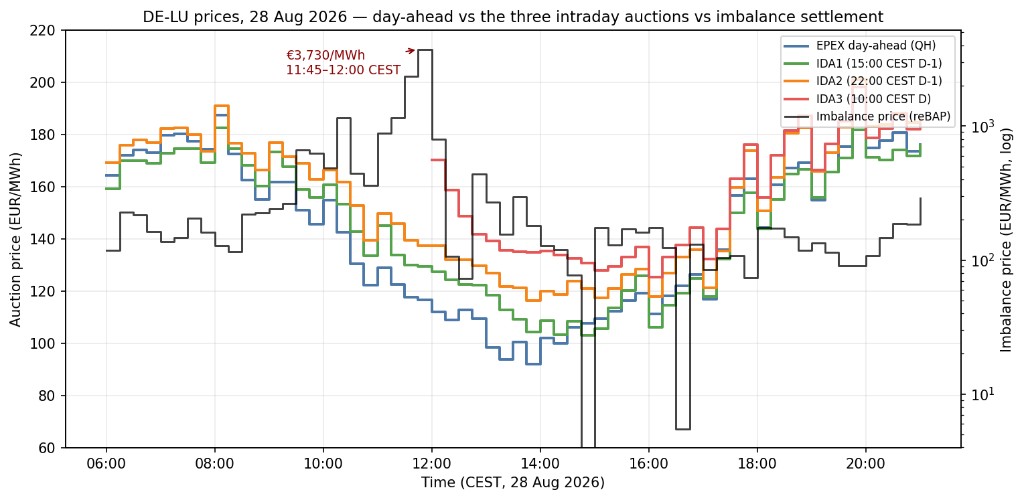
The single largest auction correction was the 10:00–10:15 UTC slot. IDA3 cleared at €170.35/MWh against a €112.08/MWh day-ahead print, a €58.27/MWh repricing. The largest IDA2 corrections clustered in the 10:00–11:45 UTC band, exactly where the solar curve stalled.
The imbalance settlement price reached €3,730.38/MWh for the 09:45–10:00 UTC quarter-hour after rising from €881.12 at 09:00 to €1,145.44 at 09:15 and €2,352.56 at 09:30. It then fell to €797.30 at 10:00 and €72.57 by 10:30.
Closing a solar short in IDA2 cost about €19/MWh over day-ahead. Closing it in IDA3 cost about €33/MWh. Leaving it to settle cost roughly €461/MWh on average and €3,613/MWh over day-ahead in the worst quarter-hour. Reacting late was roughly twenty times cheaper than not reacting at all.
Portfolio impact at 06Z
This calculation treats each 06Z forecast as the nomination for the whole German solar fleet. It values the volume deviation at the spread between the applicable imbalance price and the day-ahead price. The result is signed P&L from the imbalance spread.
On a fleet basis over daylight hours:
| 06Z forecast used | Shortfall (GWh) | Fleet spread P&L (€m) |
|---|---|---|
| Jua Power Forecast Pro | 0.8 | +1.41 |
| EPT-2.1 Helios | 3.8 | +1.69 |
| ICON-D2 | 17.4 | -9.92 |
| EC IFS | 61.1 | -17.70 |
EC IFS implied a 61.1 GWh shortfall and a €17.70 million negative imbalance-spread P&L. Jua Power Forecast Pro reduced the shortfall to 0.8 GWh and produced a positive €1.41 million spread P&L in the same calculation.
System context
The event was not amplified by an unusually tight system. DE-LU load ran between 57.9 and 60.7 GW through the morning window. Wind was at its daily low of 11.76 GW at 09:45 UTC, rising to 19.8 GW by 13:45.
Residual load peaked at 28.29 GW at 09:45 UTC, the same quarter-hour as the €3,730.38/MWh imbalance print. The solar stall, the daily wind trough, and the morning load ramp all landed together, so the system had to meet its steepest residual-load gradient of the day from balancing reserves rather than scheduled generation.
By 12:00 UTC, wind had recovered to 18.24 GW and residual load had fallen to 15.39 GW. The imbalance price had normalized to €127.54/MWh. At 12:45 UTC it turned negative at -€26.50/MWh as wind and solar both recovered.
Conclusion
Low and mid-level cloud over the German PV fleet was much heavier than most models forecast. EC IFS predicted a sunnier Germany than any other model in the comparison. ICON-D2 captured the cloud field and morning convective timing several hours earlier than EC IFS.
Across the matched delivery-day runs, Jua Power Forecast Pro recorded 0.96 GW MAE through the bust window. EPT-2.1 Helios recorded 2.06 GW, ICON-D2 3.19 GW, and EC IFS 8.50 GW.
The cost of forecast error rose sharply as delivery approached: about €19/MWh to close in IDA2, €33/MWh in IDA3, and €461/MWh on average to let it settle.
At the critical quarter-hour, Jua's 06Z forecast was 0.69 GW long. EC IFS was 8.07 GW long.
Data caveat: EPEX continuous intraday indices (ID1, ID3, and IDFULL) had not yet published for 28 August at the time of analysis. Post-auction correction is therefore measured using IDA1, IDA2, and IDA3 rather than continuous trades.