This winter looks close to normal on average across Europe's power markets. The risk comes late, in January to March. Our European Winter Outlook 2026/27 covers ten power zones from November 2026 to March 2027, and this is its main finding.
Athena, Jua's AI agent, built the outlook from start to finish, using Jua's own weather models alongside the ECMWF and NOAA forecasts. EPT-2e, our ensemble model, takes the forecast out to 60 days, two weeks past the point where the ECMWF 46 day forecast stops. Athena delivered the result as two reports. The full report carries all the detail: an El Niño chapter, scenarios, risks, a page for each country and the tables behind them. The key takeaways edition gives you the answer in a few minutes.
Key takeaways
- December to February looks close to normal. In a normal year each temperature outcome (colder, normal or milder) has a one in three chance. This year no country goes above 38%. The Nordics lean slightly colder, with Finland at a 38% chance of a colder winter.
- Most of the risk comes late. The chance of a positive NAO, the weather pattern that brings mild and windy days to northern Europe, falls from 58% in November and December to 30% in January to March.
- The costly case has a 31% chance. If high pressure settles over Greenland in late winter, Germany's residual load (the demand that wind and solar do not cover) averages 4.4 GW above normal from January to March. That is a three month mean, not a peak.
- February brings more dark, windless spells. Germany has a 58% chance of at least one 48 hour Dunkelflaute in February, against 43% in a normal winter.
- Reservoirs start low. Southern Norway's reservoirs are 23% below their 2020 to 2025 average for the time of year, and below the lowest level for that week in any of those years.
- El Niño is forecast to reach a record, so past winters are a weaker guide. The main El Niño index is forecast to run higher this winter than in any winter in our record.
- The weeks ahead lean colder. In our 60 day forecast, which blends Jua's EPT-2 and EPT-2e with the ECMWF and NOAA models, every week from 19 October to 26 November leans colder in at least 8 of the 10 countries.
The winter at a glance
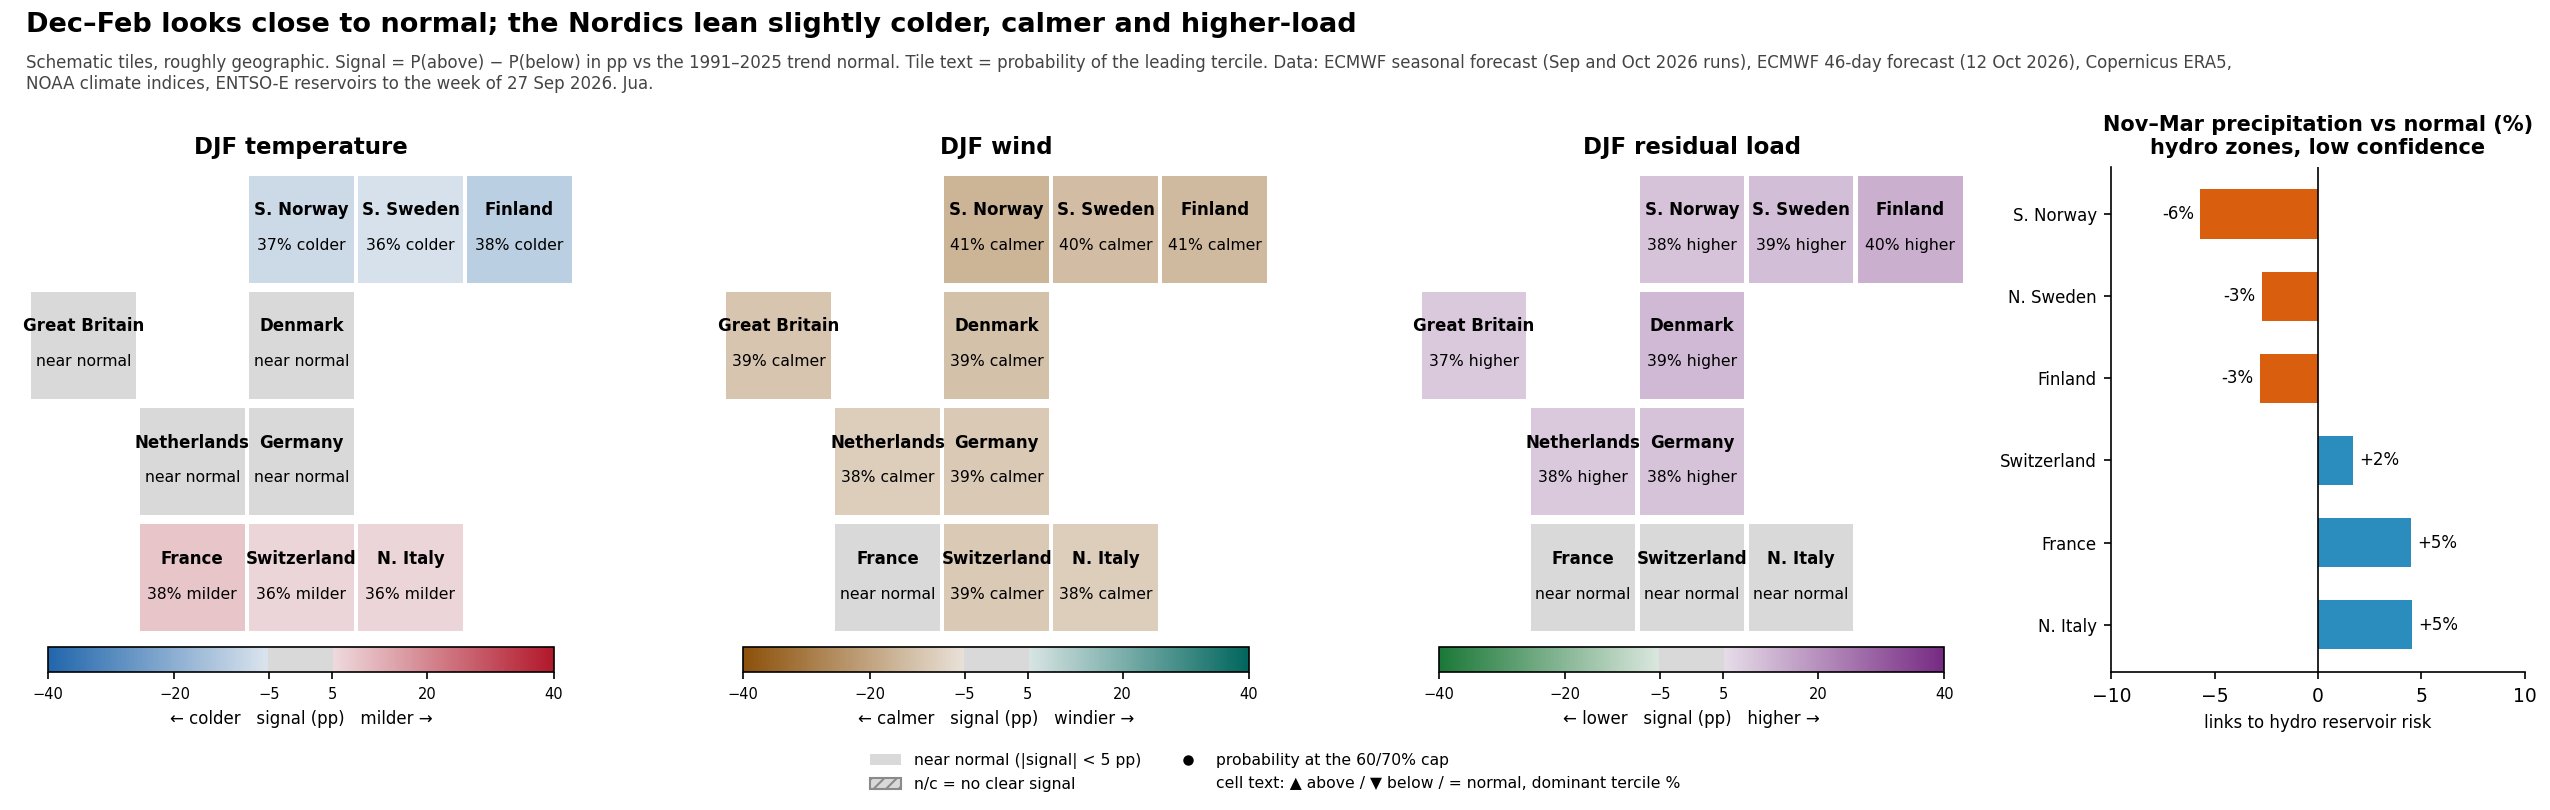
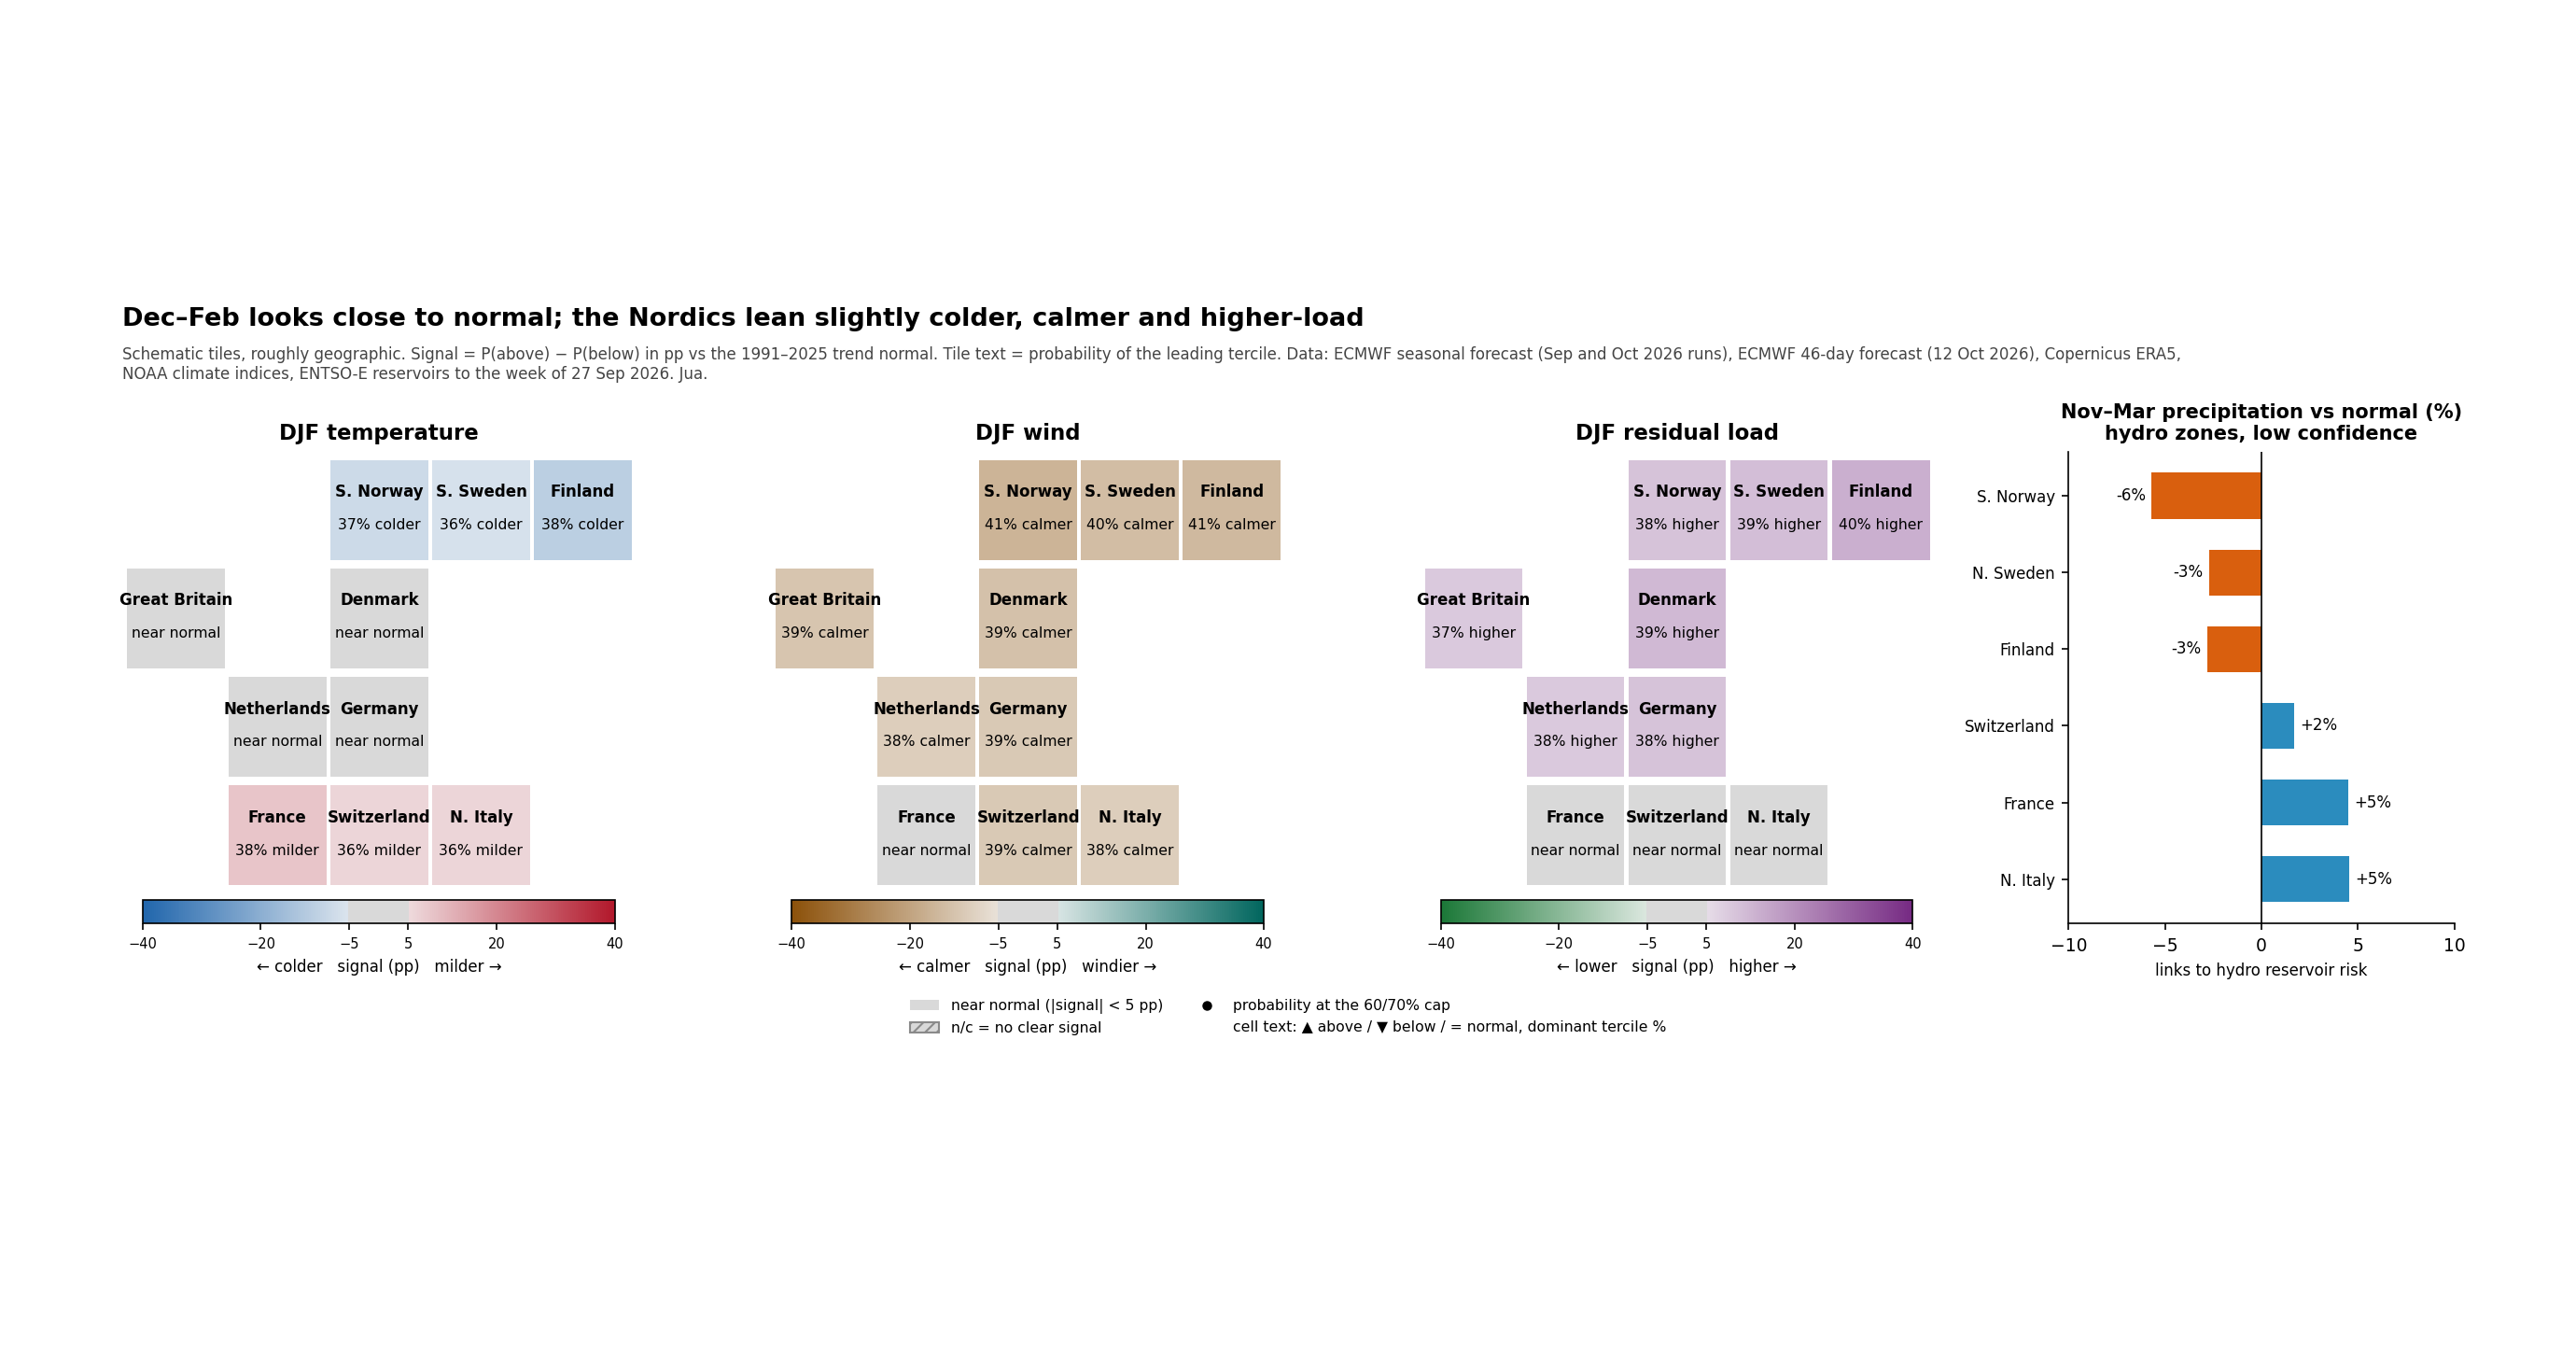
Start with this chart. Each square is a country, placed roughly where it sits on the map. Grey means close to normal. A colour means the odds lean one way, and the text in the square says how far. The first panel is temperature (blue for colder, red for milder), the second is wind (brown for calmer, teal for windier) and the third is residual load (green for lower, purple for higher). The fourth panel shows rain and snow for the zones where hydro matters.
Across the panels, the south leans slightly milder and the Nordics slightly colder. Most countries lean calmer, and most lean towards higher residual load. The strongest tilts reach about four in ten, against one in three in a normal year, so these are modest shifts in the odds.
Residual load is the part of power demand that wind and solar do not cover, so other plants and imports have to supply it. Here it is simply demand minus wind and solar: nuclear, hydro and imports are not subtracted. Normal means the 1991 to 2025 average, adjusted to today's warmer climate.
The risk moves into late winter
The main driver is the North Atlantic Oscillation, or NAO. Think of it as a pressure seesaw between Iceland and the Azores. When the NAO is positive, strong westerly winds carry mild, wet and windy weather into northern Europe. When it is negative, those winds weaken and cold air can settle in.
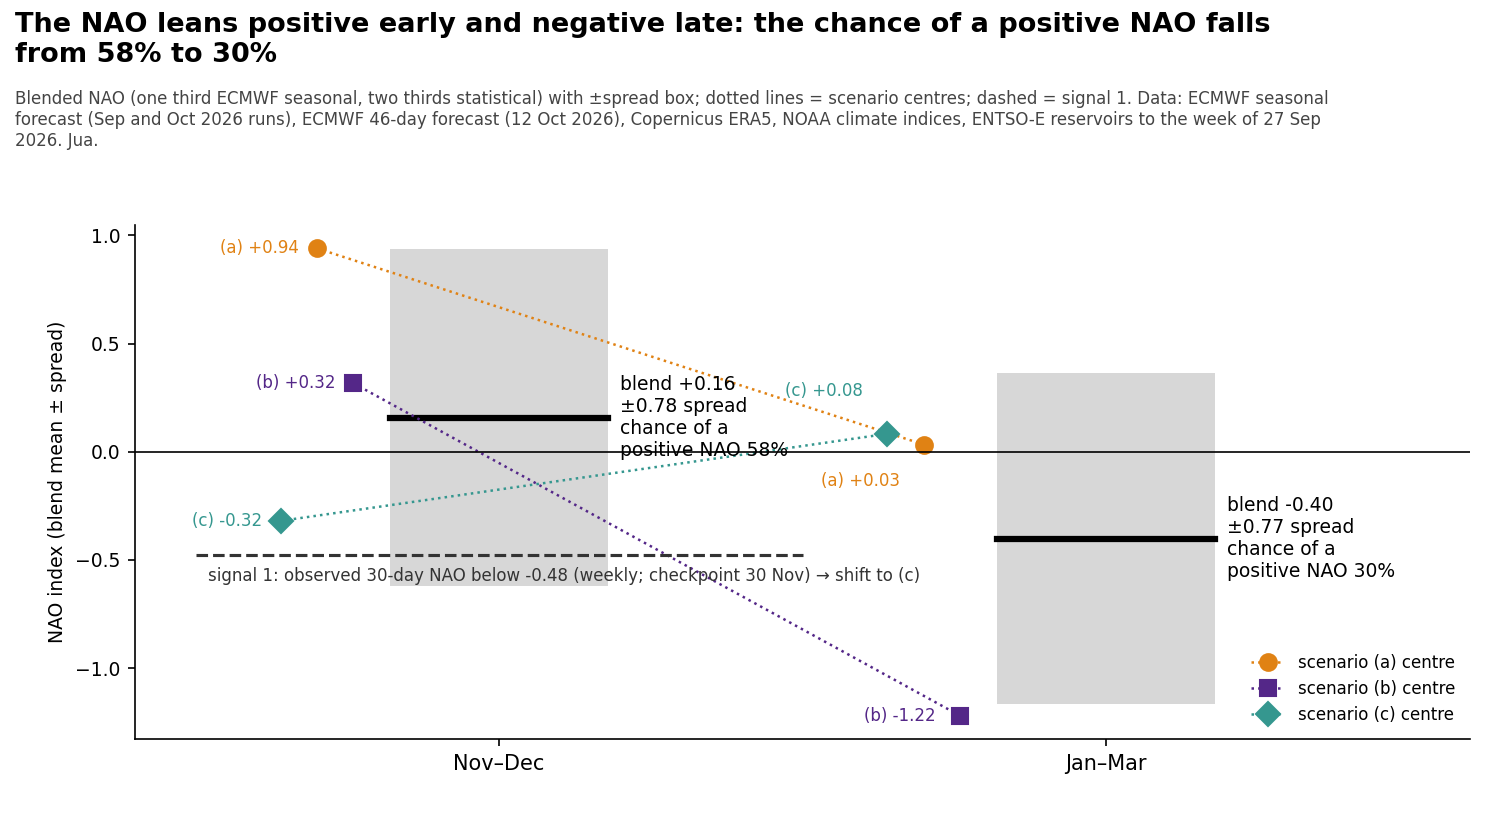
Our forecast gives the NAO a 58% chance of being positive in November and December. For January to March that drops to 30%. The month by month view follows the same turn:
- November leans colder in all 10 countries, but also windier in 7.
- December leans milder in all 10, with lower residual load in all 10.
- January to March leans colder in 7, calmer in 8 and towards higher residual load in all 10.
The seasonal forecast from ECMWF, the European weather centre, also has Greenland Blocking on about 34% of February days. That is a high pressure system that parks over Greenland and steers cold air towards Europe while the wind drops. In past winters it showed up on about 9% of February days.
A record El Niño with no exact precedent
A strong El Niño is under way. The tropical Pacific is about 2.2 °C warmer than normal, and the ECMWF seasonal forecast puts the main El Niño index (Niño 3.4) at +3.6 °C for December to February. The strongest winter in our record, 2015/16, reached +2.5 °C.
History helps with early winter. In past strong El Niño winters the NAO leaned positive in November and December under all three definitions we tested, which matches this year's early lean. Late winter is mixed. Whether those late winters were more negative than usual depends on which years you count as strong. Europe is also a long way from the Pacific, and the Atlantic and the Arctic usually matter more. So we use past El Niño winters as one input next to the forecast.
Three ways this winter could go
Athena simulated 3,000 winters and grouped them into three scenarios. Scenarios (a) and (c) describe November and December. Scenario (b) describes January to March.
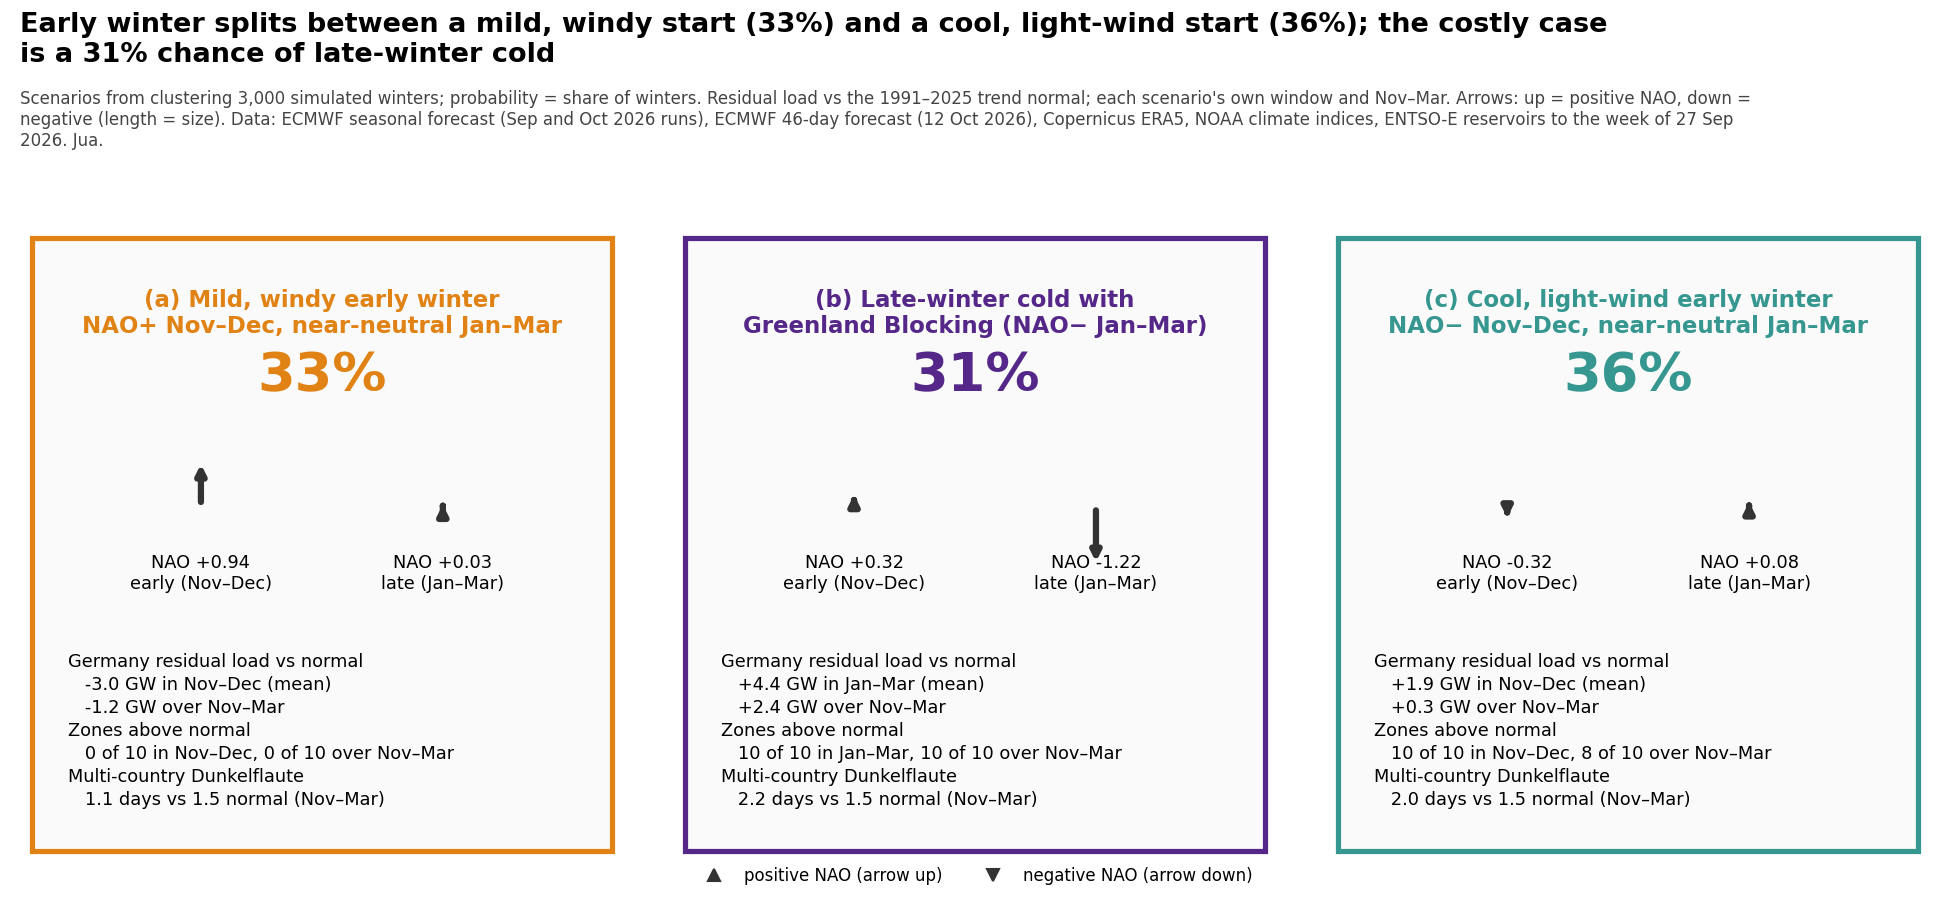
| Scenario | Chance | German residual load vs normal |
|---|---|---|
| (a) Mild, windy early winter | 33% | 3.0 GW lower, November to December mean |
| (b) Late winter cold with Greenland Blocking | 31% | 4.4 GW higher, January to March mean |
| (c) Cool early winter with light wind | 36% | 1.9 GW higher, November to December mean |
The two early winter scenarios are about equally likely. Scenario (b) is the costly one. In that case all 10 countries see residual load above normal from January to March, and Germany sees the largest rise in GW. Of Germany's 4.4 GW, about 3.2 GW comes from weaker wind and about 1.3 GW from higher demand in the cold (the parts are rounded). Solar makes no difference.
The worst single days are much larger than that three month mean. We looked at every November to March day since 1991 that fell in the coldest and calmest fifth of winter days during a blocking pattern. On half of those days, German residual load ran at least 20.9 GW above normal. On one in ten, it ran at least 27.3 GW above normal. The longest run of such days lasted a week.
Dark, windless spells: the Dunkelflaute odds
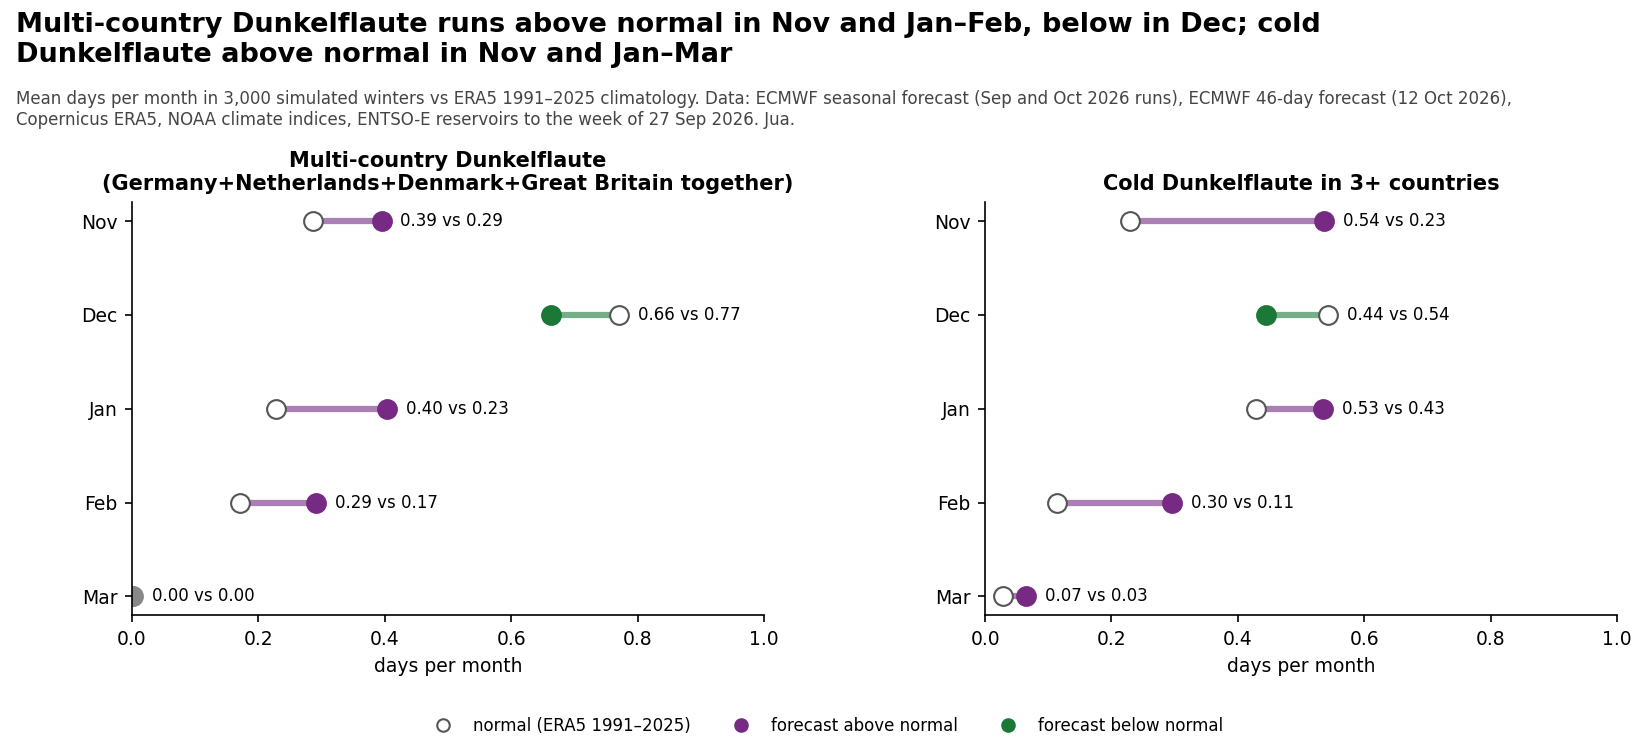
Dunkelflaute is German for "dark doldrums": a stretch when wind and solar output both stay very low. We count one when their combined output stays below the lowest tenth of a normal winter for 48 hours or more.
- Germany in February: a 58% chance of at least one 48 hour Dunkelflaute, against 43% normally.
- Germany from December to February: a 48 hour spell happens in almost every winter (96% this winter against 94% normally), so the February number tells you more.
- Germany, the Netherlands, Denmark and Great Britain at the same time: a 29% chance between November and March, against 20% normally.
By month, Dunkelflaute across these four countries runs above normal in November, January and February, and slightly below normal in December.
Reservoirs start the winter low
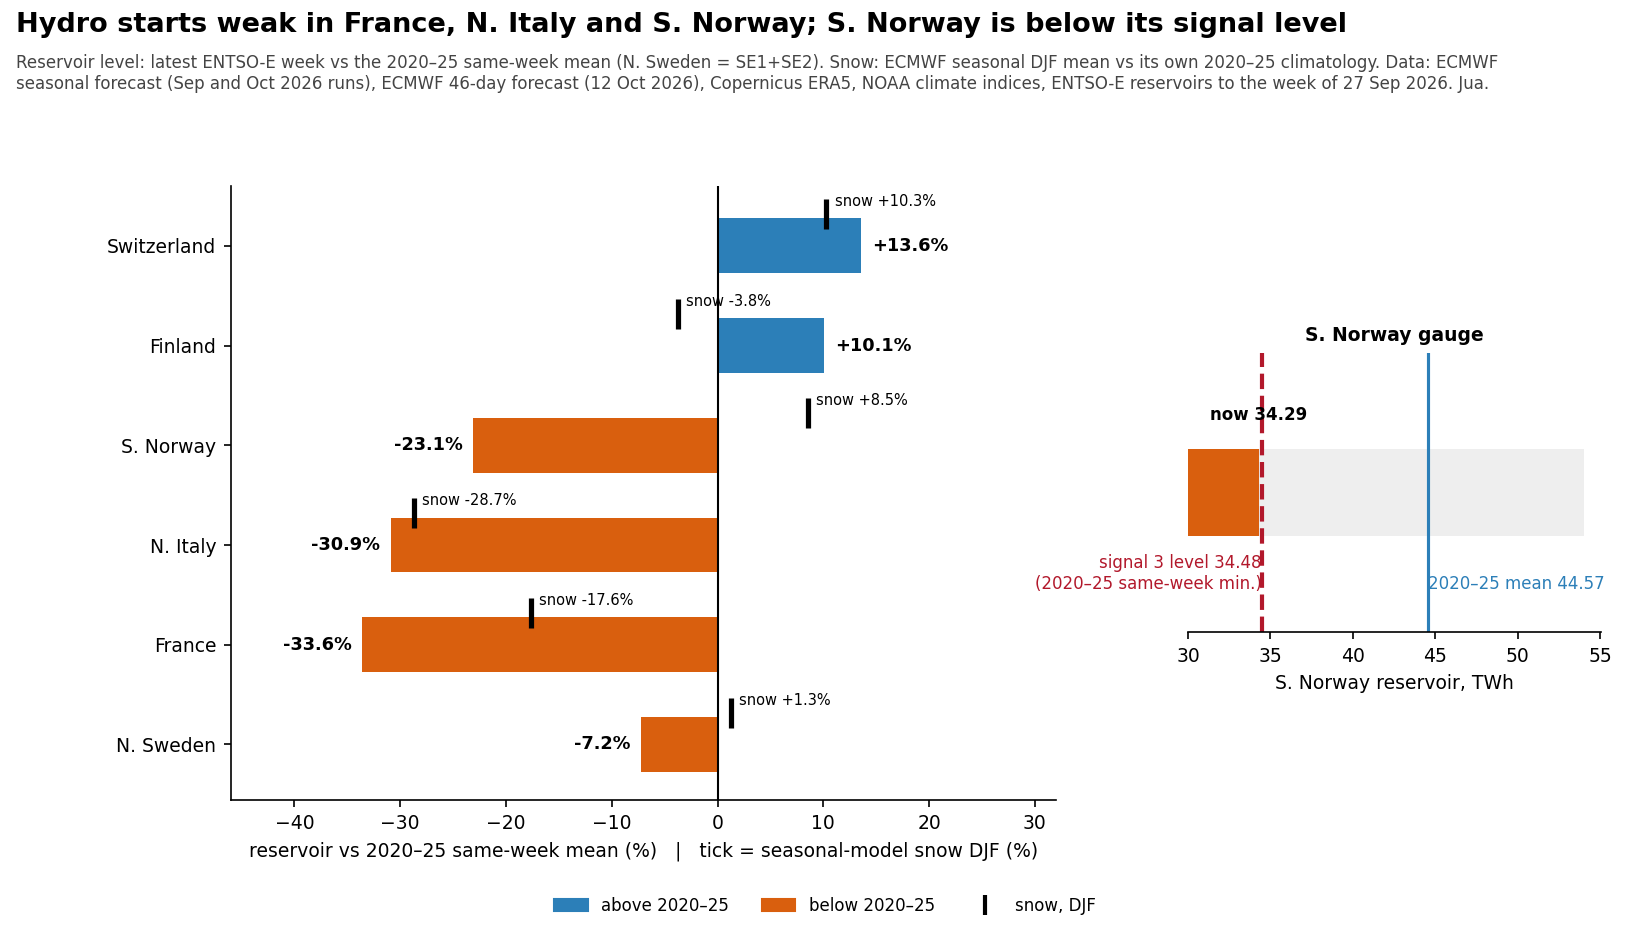
Nordic and Alpine power depends on water stored in reservoirs, and several start the winter low. At the end of September, Southern Norway held 34.3 TWh. That is 23.1% below its 2020 to 2025 average for the same week, and 0.2 TWh below the lowest level for that week in those years. France is 33.6% below average and Northern Italy 30.9% below. Switzerland (13.6% above) and Finland (10.1% above) start in better shape.
Rain and snow may not make up the gap. The seasonal forecast has Southern Norway's November to March precipitation about 6% below normal, though with low confidence. If late winter turns cold and still, less Nordic power may be available to export to Germany, Denmark and the Netherlands.
The next 60 days, with Jua's EPT-2e
The first 60 days come from a blend of weather models, including Jua's own:
- Weeks one and two: Jua's EPT-2 and EPT-2e run alongside the ECMWF and NOAA ensembles.
- Week three to day 46: the ECMWF 46 day forecast leads, with EPT-2e and the NOAA ensemble alongside.
- Days 47 to 60: the ECMWF forecast has ended. EPT-2e takes most of the weight on day 47 and hands over gradually to the seasonal forecast by day 60.
Every week from 19 October to 26 November leans colder in at least 8 of the 10 countries, and the first three weeks also lean calmer and towards higher residual load. In the last two weeks, from 27 November, where EPT-2e hands over to the seasonal forecast, the lean turns milder, with low confidence. Beyond the second week, all of these signals are modest shifts in the odds.
Three signals to watch
These three signals would change the view most:
- The observed NAO. We check its average over the last 30 days every week, with a checkpoint on 30 November. So far it is positive. If it falls below minus 0.48, the odds move from the mild, windy start towards the cool start with light wind.
- The November ECMWF seasonal forecast, due around 6 November. If our late winter NAO forecast rises to neutral or above once that run is in, the late winter blocking scenario loses weight.
- Southern Norway's reservoirs. Our warning level is the lowest level for this week in 2020 to 2025. Reservoirs are already below it, so we now rate Nordic hydro risk as high.
How Athena built it
Athena is Jua's AI agent for weather driven energy decisions. The numbers in this outlook are computed, not generated by AI. Athena works inside a harness on the Jua platform: the language model plans the analysis and writes the text, and every number comes from code that pulls the forecasts and 35 years of past weather, runs the statistics and saves each result as a table. The charts are drawn by code from the same tables. Before the reports went out, an automated check matched every number in the text to the table it came from.
The method, in short:
- For the first 60 days, it blends Jua's EPT-2 and EPT-2e with the ECMWF and NOAA forecasts. EPT-2e takes most of the weight from day 47, where the ECMWF 46 day forecast ends.
- For December to March, it combines the ECMWF seasonal forecast with a statistical NAO forecast. The statistical part uses only observed climate indices and similar past years, so it is independent of the ECMWF model.
- It sorts daily pressure patterns into European weather regimes, such as Greenland Blocking.
- It builds 3,000 simulated winters from 5 to 10 day blocks of real weather between 1991 and 2025, weighted so that together they match the forecast. These give the ranges and the scenarios.
Both reports are written from the same saved tables, which is why the key takeaways and the full report match number for number.
Get the full reports
The previews below are blurred. Scroll through to see what is inside: the full report has 27 charts, the El Niño chapter and a page for each of the ten countries, and the key takeaways edition has 8 charts. Talk to our sales team to get them in full.

For anything else about the outlook, write to [email protected].
This is weather risk analysis, not investment advice. The probabilities describe weather and load, not prices. Data: ECMWF, Copernicus ERA5 (contains modified Copernicus Climate Change Service information), the ENTSO-E Transparency Platform, NESO and NOAA climate indices.