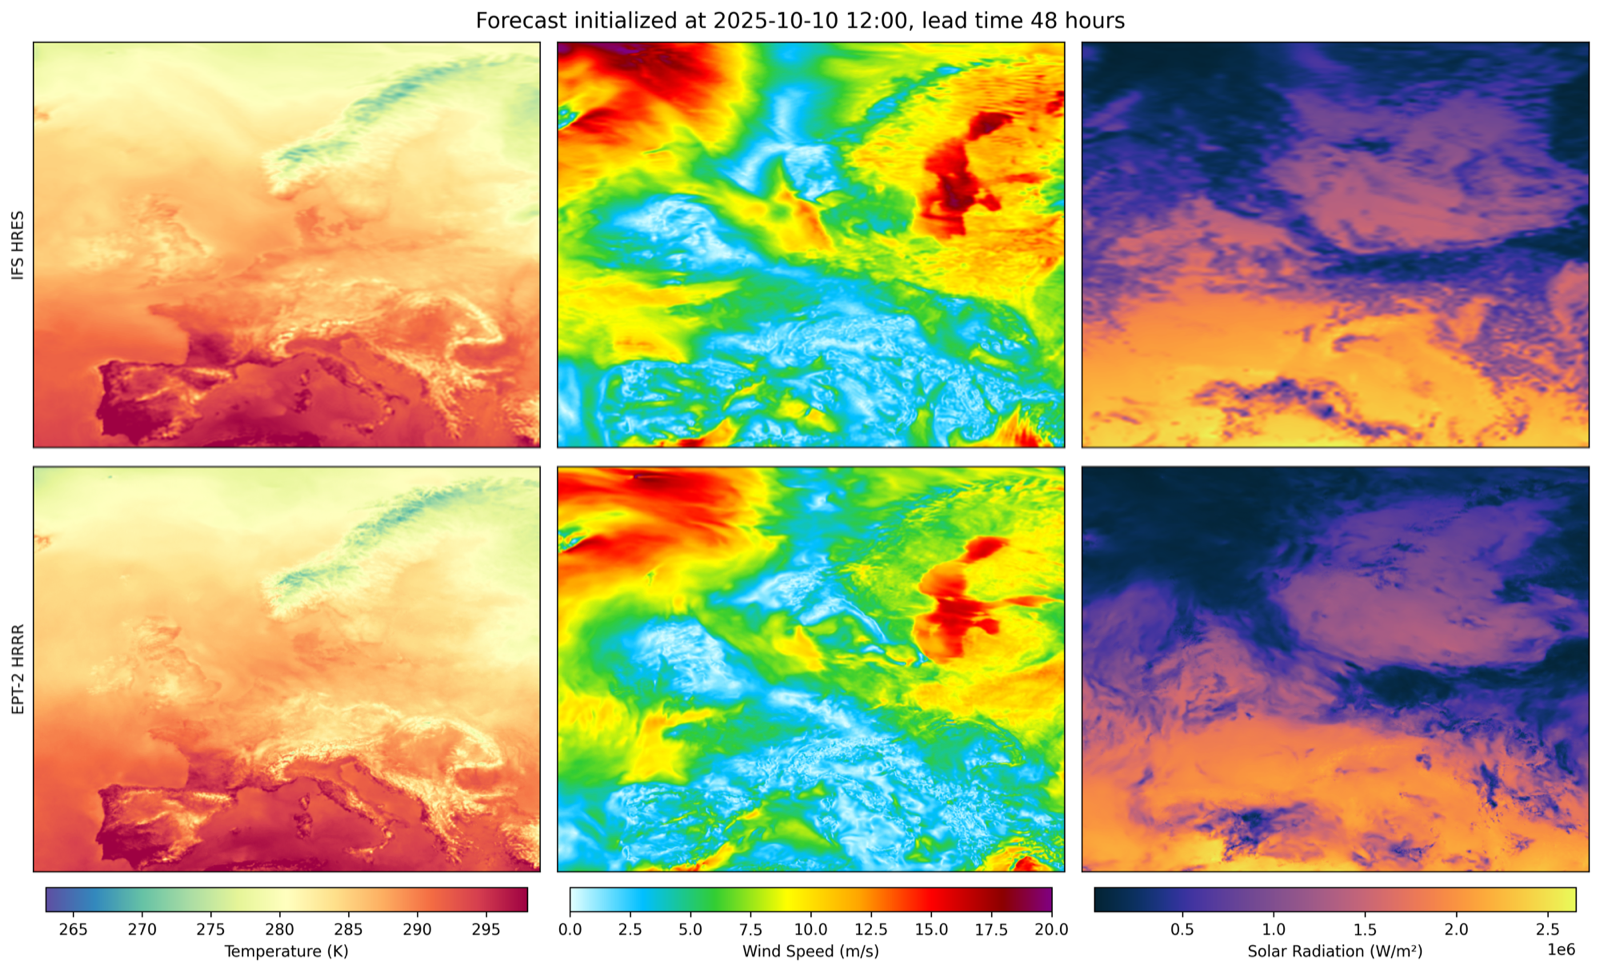
For half a century, weather forecasting was led by numerical weather prediction: computer models that calculate how the atmosphere evolves from the laws of physics. AI eventually began beating these systems on average scores, but one boundary was expected to remain: extremes.
The common belief sounded simple: AI learns patterns from the past. How could it predict weather outside what it had seen before? When rare conditions appeared, AI was expected to fall back toward familiar, average weather, while physical models could continue following the equations of the atmosphere.
We tested that belief against reality: eleven forecast systems, ten months, thousands of European weather stations, four surface variables, and forecasts up to 48 hours ahead.
The test overturned that expectation.
Modern AI systems beat ECMWF's operational Integrated Forecasting System (IFS) in extreme wind, temperature, solar, and precipitation conditions. The strongest gains reached 19.6% in the highest temperature conditions, 9.0% in the highest-wind conditions, and 24.8% among the highest solar readings.
One pattern did hold across the board: at the extremes themselves, every evaluated model—AI and physical alike—predicts values less extreme than what is then observed.
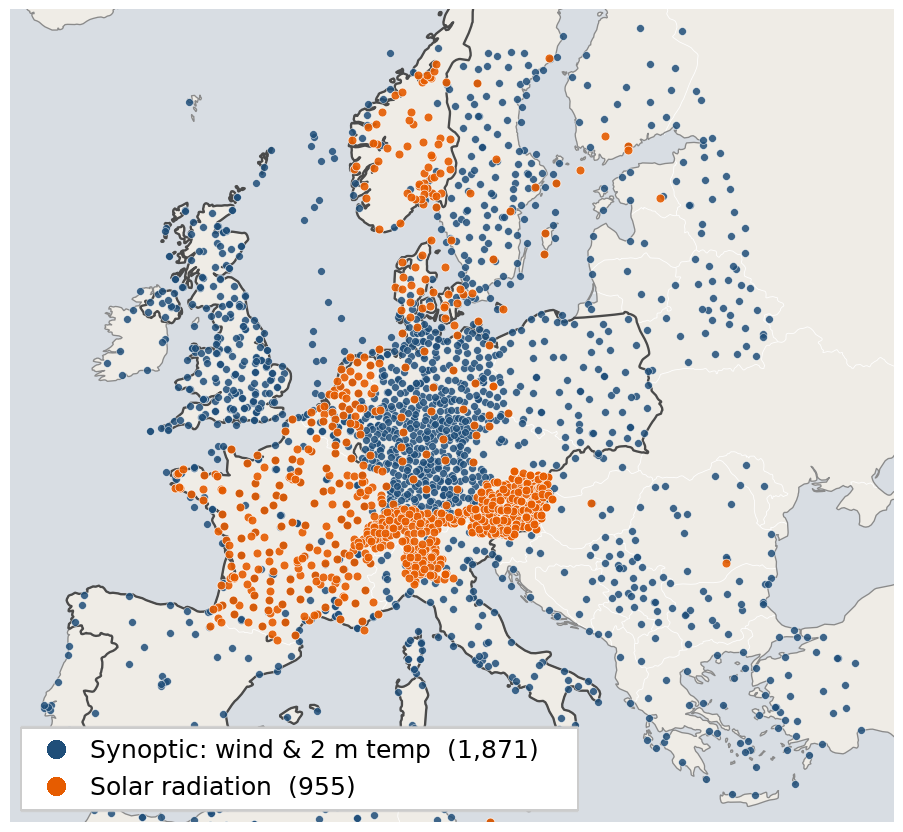
The European observation network used to test forecasts against reality: 1,871 wind and temperature stations in blue and 955 solar-radiation stations in orange. Precipitation uses a separate panel of 4,005 rain gauges.
The boundary AI was not supposed to cross
Early AI weather systems gave researchers good reasons to worry. A Storm Ciarán case study found that several models captured the storm track and central pressure but underestimated peak winds. A broader evaluation of weather extremes found that data-driven models became less competitive for hot and windy extremes at longer forecast horizons.
These failures seemed to confirm the basic objection. An AI system trained to be right most often has an incentive to play it safe. Because extreme conditions are rare, predicting something closer to normal can reduce its average error—even when that means missing the events that matter most.
But those studies mostly evaluated AI systems released between 2022 and 2024, often against reanalysis: a gridded reconstruction of past weather. The field has since changed. New global models, high-resolution regional systems, ensembles that produce multiple possible forecasts, and specialised models now coexist with traditional physical forecasts.
Today's systems posed a sharper question: is failure at extremes an unavoidable property of AI weather models?
We tested forecasts against reality
We compared eleven forecast systems with ECMWF IFS, one of the world's leading operational physical weather models. The set includes global and regional physical models, AI systems that produce a single forecast, AI ensembles that produce multiple possible forecasts, and a solar-specialised model.
The forecasts were verified against:
- 1,871 synoptic stations for 10-metre wind and 2-metre temperature
- 955 solar-radiation stations
- 4,005 rain gauges
- Thirteen European countries for the primary wind and temperature comparison
- Forecast horizons from one to 48 hours
Each head-to-head score uses forecasts started at the same time and checked against the same observations. None of the Jua systems were trained or fine-tuned on these station panels.
To determine what counts as extreme, we compare each observation with what was normal for the same place, season, and hour during 1991–2020. Every model is therefore tested on the same calm, cold, typical, warm, hot, high-wind, low-solar, high-solar, and precipitation conditions.
The result: AI crossed the boundary
The leadership extends across the observed distribution. Across all conditions and five observed-condition bands for each of the four variables—24 headline comparisons—a Jua model has the highest point estimate in 23. The remaining highest-wind comparison is effectively tied within uncertainty.
IFS is the operational flagship of ECMWF, the European Centre for Medium-Range Weather Forecasts, and the physics-based system widely treated as the gold standard for global weather forecasting. Its forecasts are used by national weather services, energy companies, and professional forecasters worldwide.
Every percentage below is measured directly against that standard. A positive
value means the model produces less error than IFS. The ± values show how
much the result varies when individual months are left out.
- Wind: Jua leads overall and in five of the six displayed comparisons.
EPT-2.1 Europa reduces error by 8.4% across all conditions, reaches
+11.3 ± 0.7%in typical wind, and remains at+9.0 ± 1.2%in the highest-wind conditions. DWD ICON Global reaches+9.5 ± 1.2%there, effectively level with Europa. - Temperature: Jua holds the top two positions in every condition band.
EPT-2 HRRR reduces error by 12.1% overall and
19.6 ± 2.2% in the highest-temperature conditions. EPT-2.1 Europa
follows at
+11.5%overall and+15.0 ± 1.7%in the upper tail. - Solar: a Jua model leads every condition band. EPT-2.1 Helios leads five
of the six, including 24.8 ± 5.4% lower error in the highest 5% of solar
observations and
+16.4 ± 3.4%in low-solar conditions. EPT-2 Reasoning leads typical solar conditions at+14.0 ± 0.7%. - Precipitation: Jua leads all conditions and every intensity band.
EPT-2.1 Europa reaches
+21.0 ± 2.7%in dry hours, three Jua systems reach roughly 14–15% in moderate rain, and EPT-2 Reasoning leads the heaviest tail at+1.7 ± 0.5%.
The supposed class-wide AI deficit disappears across the full distribution, from the average conditions through the tails.
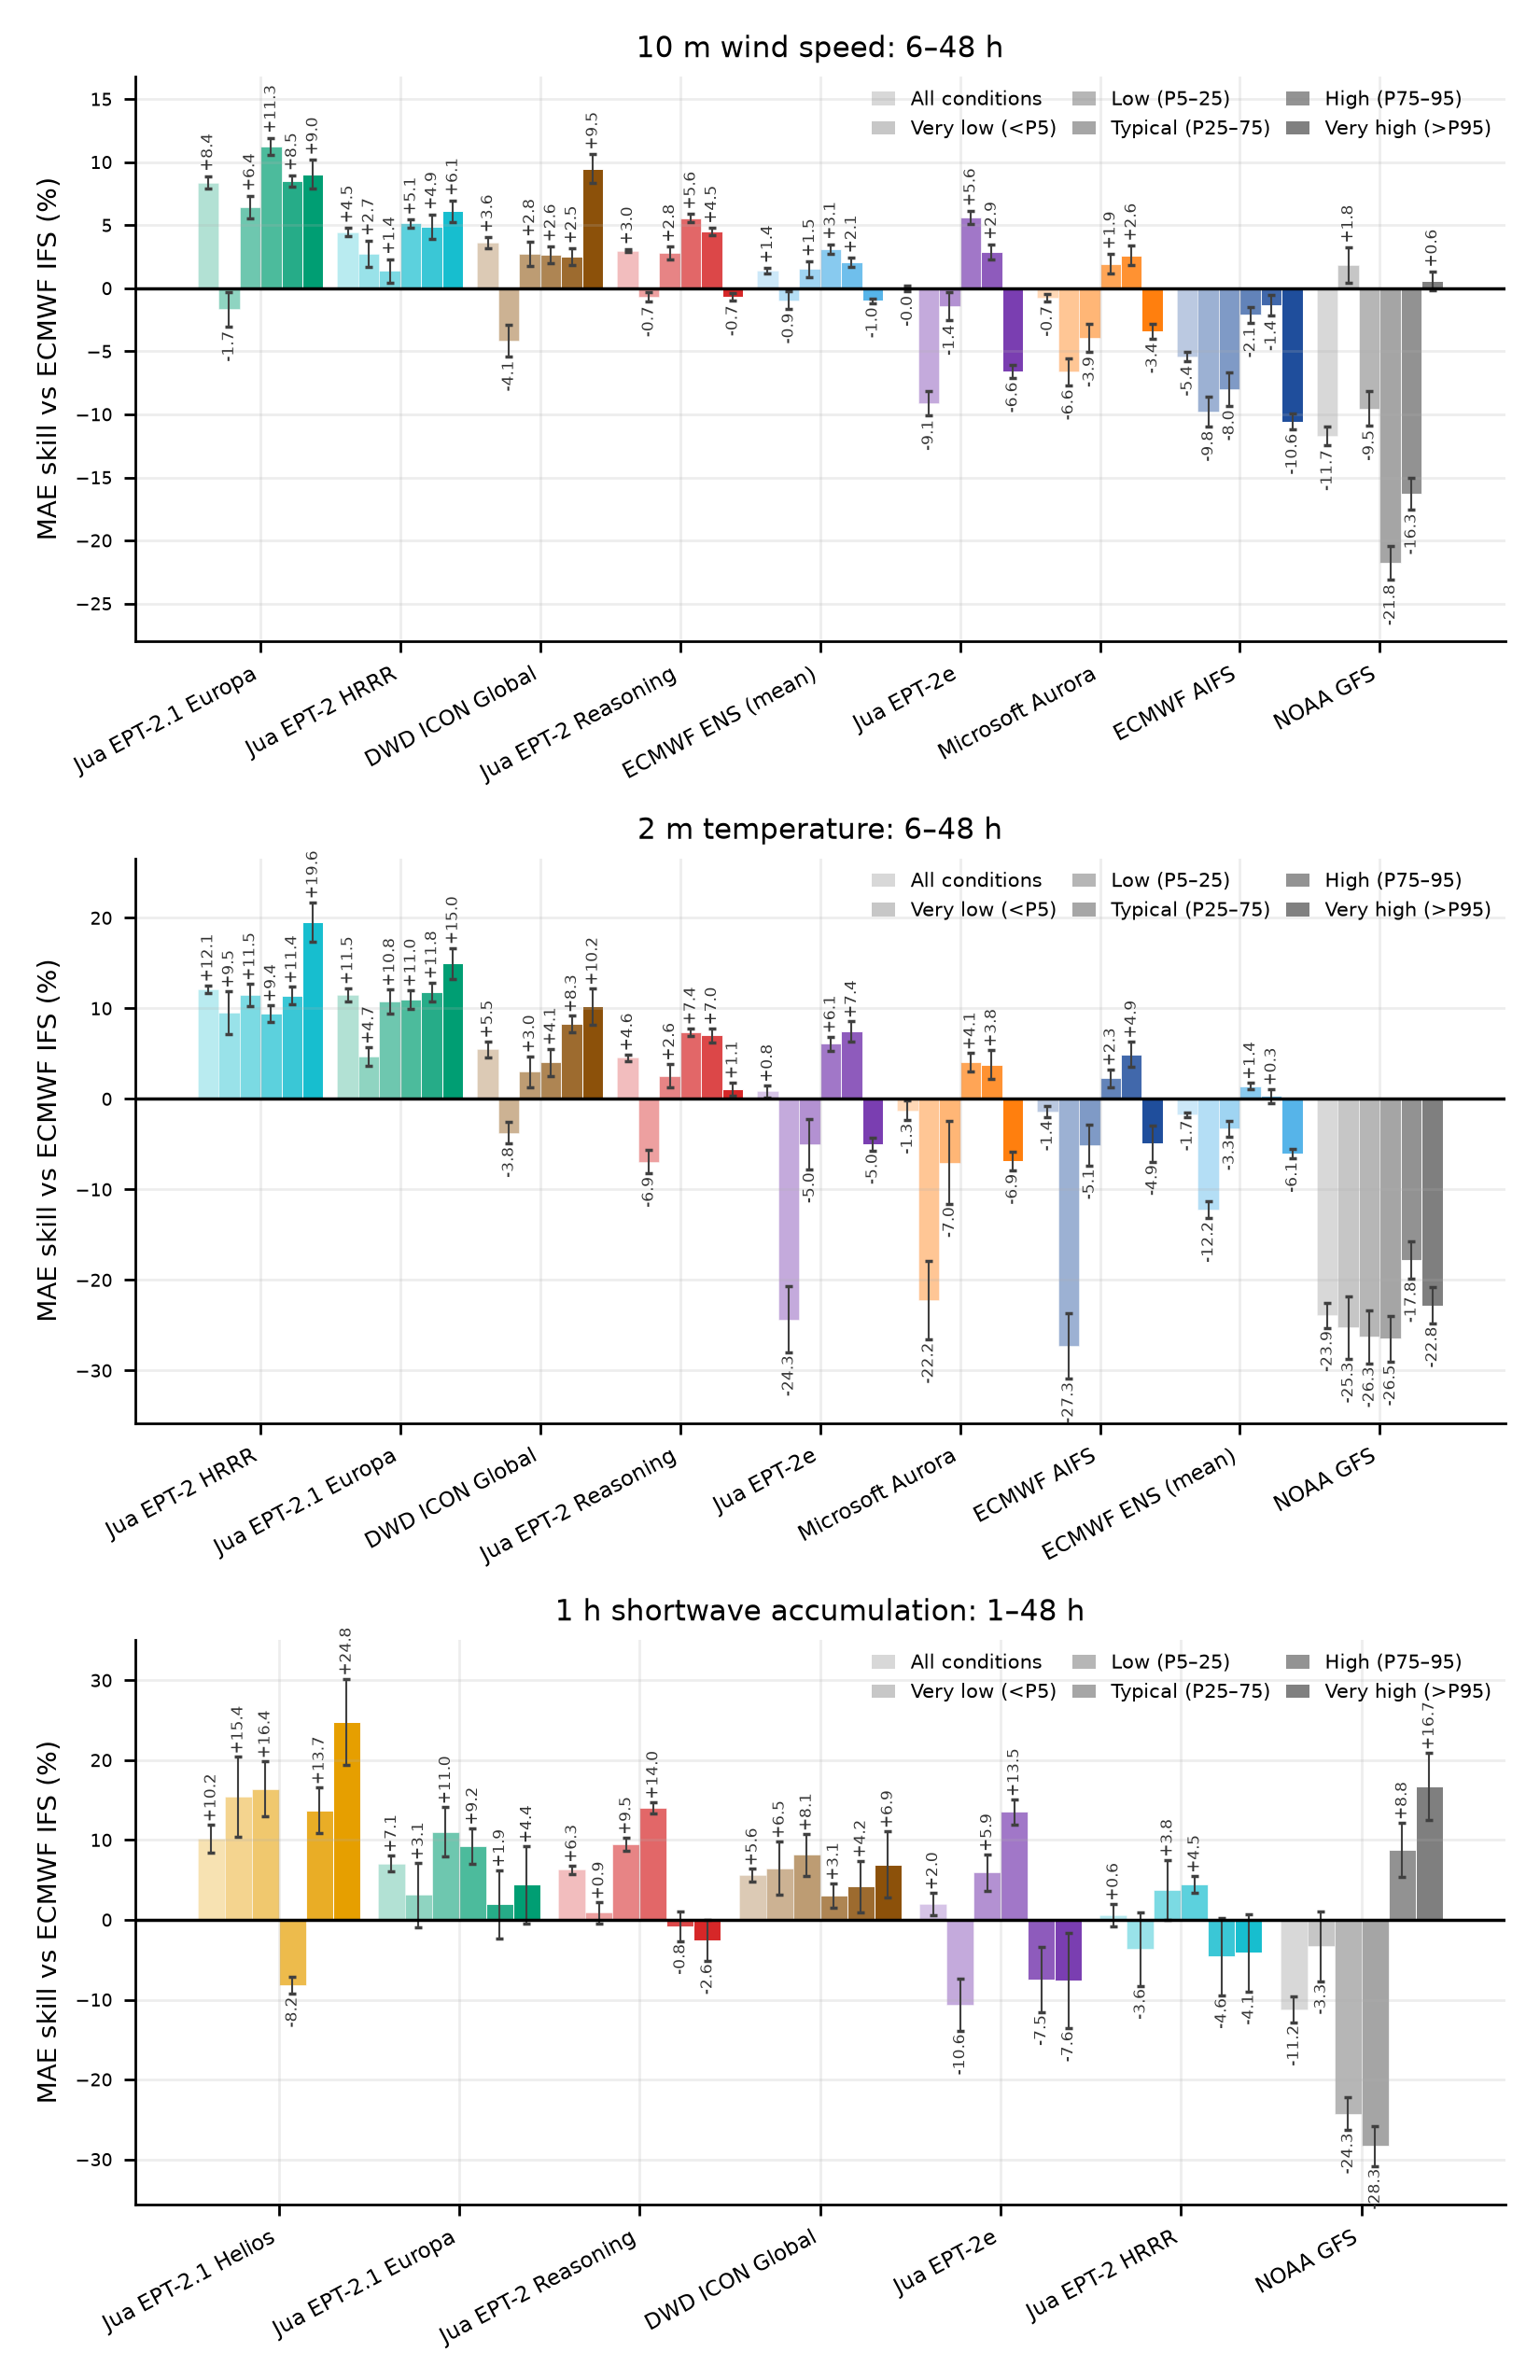
Europe-pooled error relative to ECMWF IFS across observed conditions. Positive values mean lower error; error bars show month-to-month uncertainty.
Explore the evidence
Select a weather variable, forecast horizon, geographic comparison, and observed condition. The explorer opens on the primary benchmark: ten months, Europe pooled, full global model set. The regional study and country profiles are shorter secondary analyses with their own model sets. Bars above zero mean lower error than ECMWF IFS; bars below zero mean higher error.
Technical details for benchmark readers
The metric is MAE skill relative to IFS:
100 × (1 − MAE model / MAE IFS). Scores use matched samples for
each country, variable, forecast hour, and observed regime.
Wind, temperature, and solar regimes use ERA5 1991–2020 P5, P25, P75, and P95 thresholds for each station location, calendar day, and UTC hour. Precipitation uses a dry category below 0.1 mm and percentiles of wet hours. Pooled uncertainty is ±1 leave-one-month-out jackknife standard error. All models use the same causal correction protocol for their variable, estimated only from earlier errors.
Each horizon pools a model's native forecast hours and never interpolates: the 6–48 h view compares all models on a shared 6-hourly grid, while the hourly 1–48 h and 1–12 h views cover the models with hourly output. ECMWF ENS precipitation is scored on its native 6-hourly cadence. When a model has no data for a combination, the explorer shows it disabled with the documented reason instead of dropping it silently.
Every model still underestimates the tails
Lower average error than IFS can coexist with underestimating the full magnitude of an extreme observation. At 48 hours, every evaluated model forecasts low observations too high and high observations too low.
For the highest-wind conditions, all systems underforecast observed wind by roughly 2.2–2.9 m/s. In the highest-temperature conditions, every model forecasts too cold. The same shape appears in solar radiation and precipitation.
This tendency is often attributed to AI models producing overly smooth forecasts. The data point elsewhere: the same conditional bias appears across the entire model set, including ECMWF IFS and the other physics-based systems. Understating the rarest observations is what imperfect forecasts of any kind look like at the tails—not an AI fingerprint.
It also cuts the other way: a smoother forecast can still be the more accurate one in every regime. EPT-2.1 Europa and DWD ICON Global share this conditional bias while producing much lower error than other systems in the same high-wind observations. The bias is common; its error cost is model-specific.
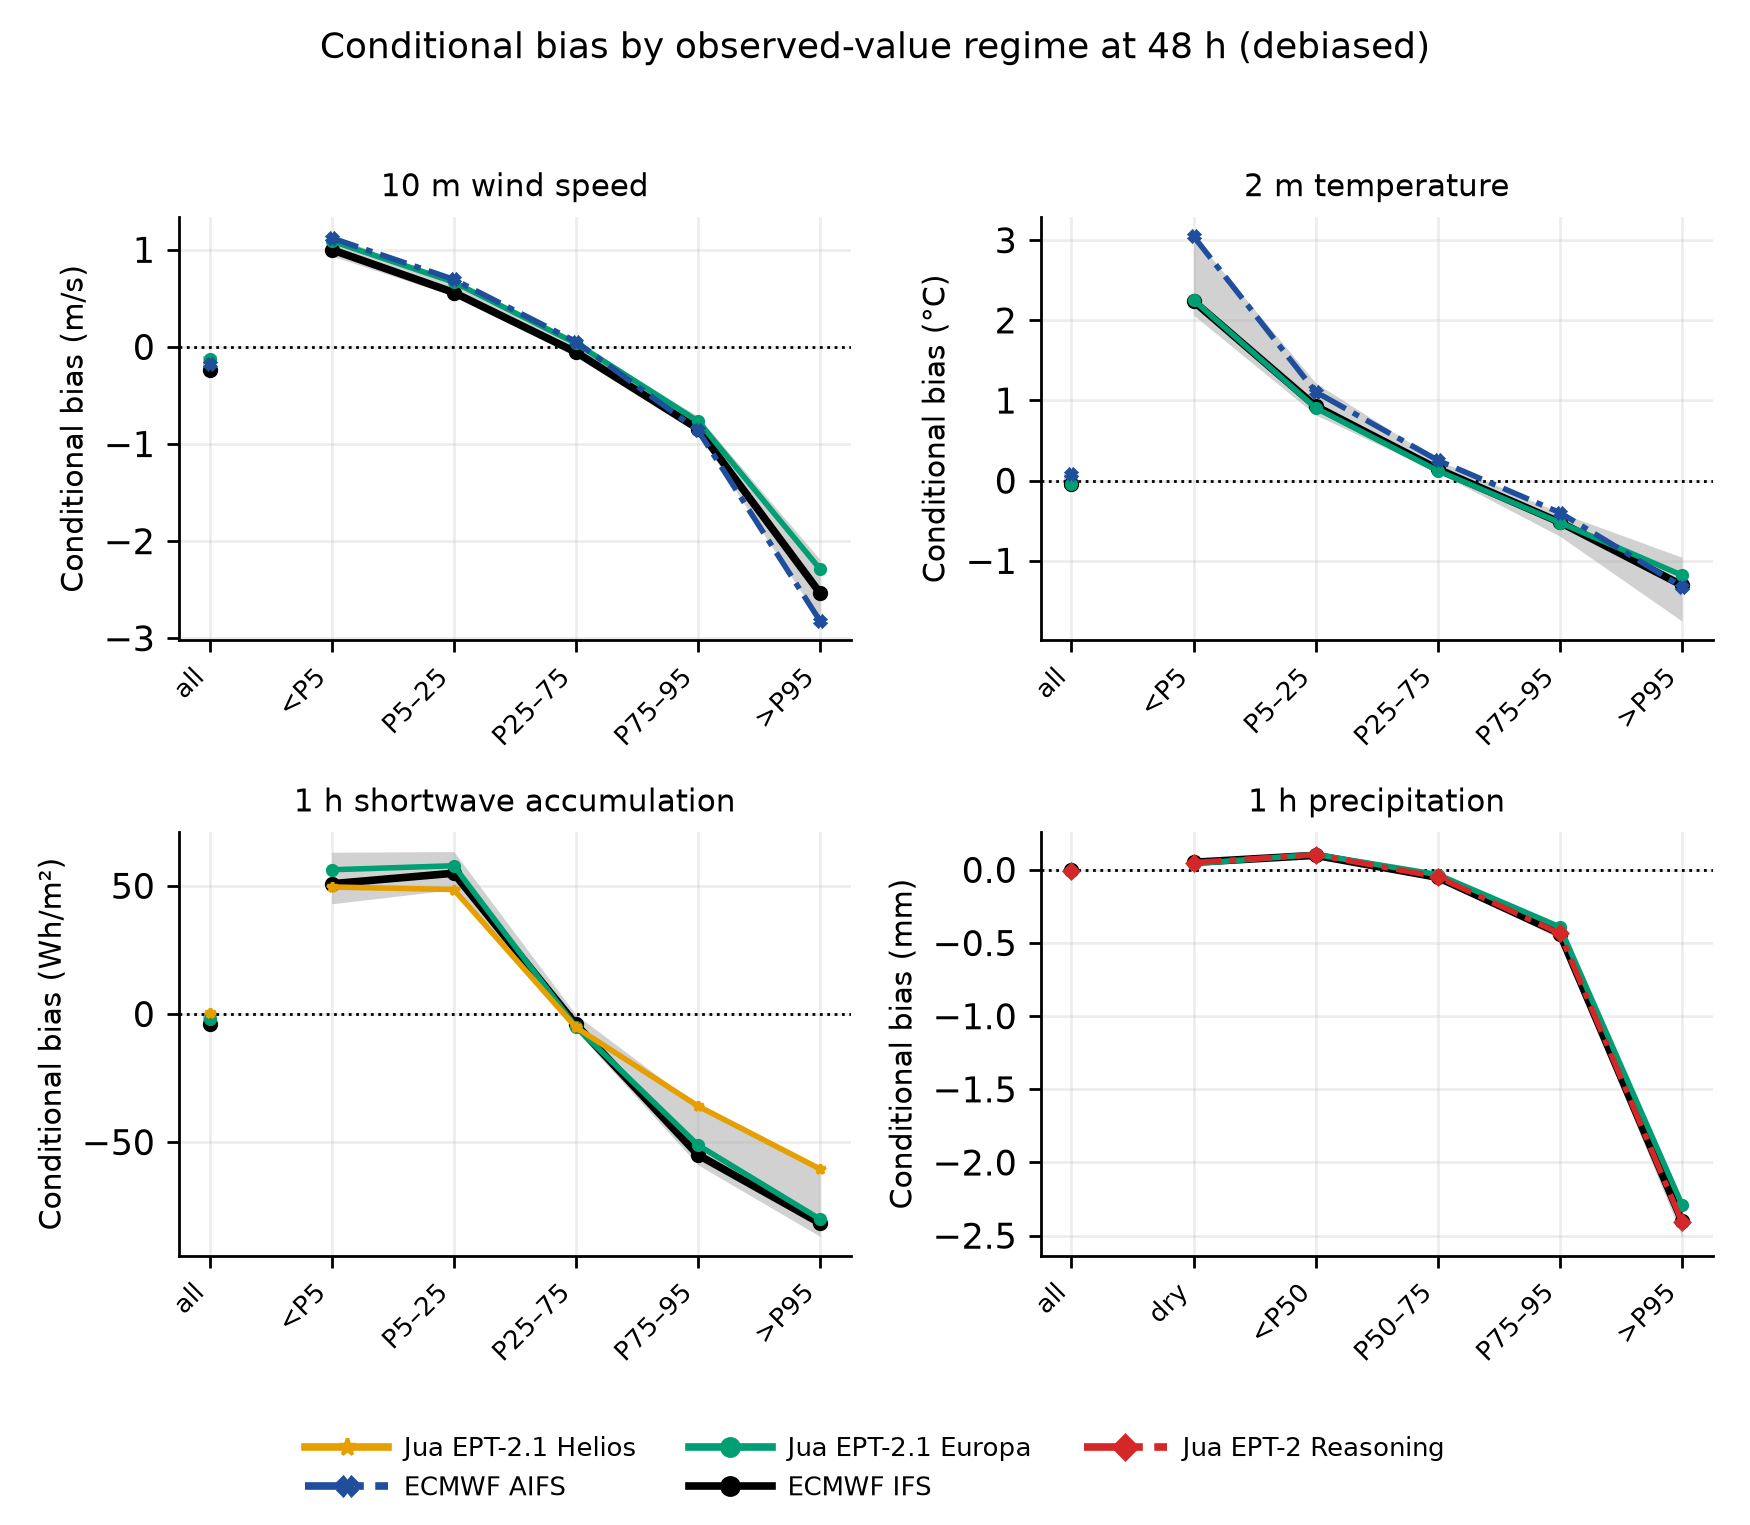
Forecast bias at 48 hours. AI and physical systems show the same pull toward average conditions.
Physical models no longer own the tails
The four-month regional comparison reinforces the finding. It adds DWD ICON-EU, a high-resolution physical model, and compares it with the regional AI systems on a common hourly schedule.
EPT-2.1 Europa has the highest overall wind score. ICON-EU matches the leading AI systems in the highest wind and temperature conditions. EPT-2.1 Helios has the highest solar estimate.
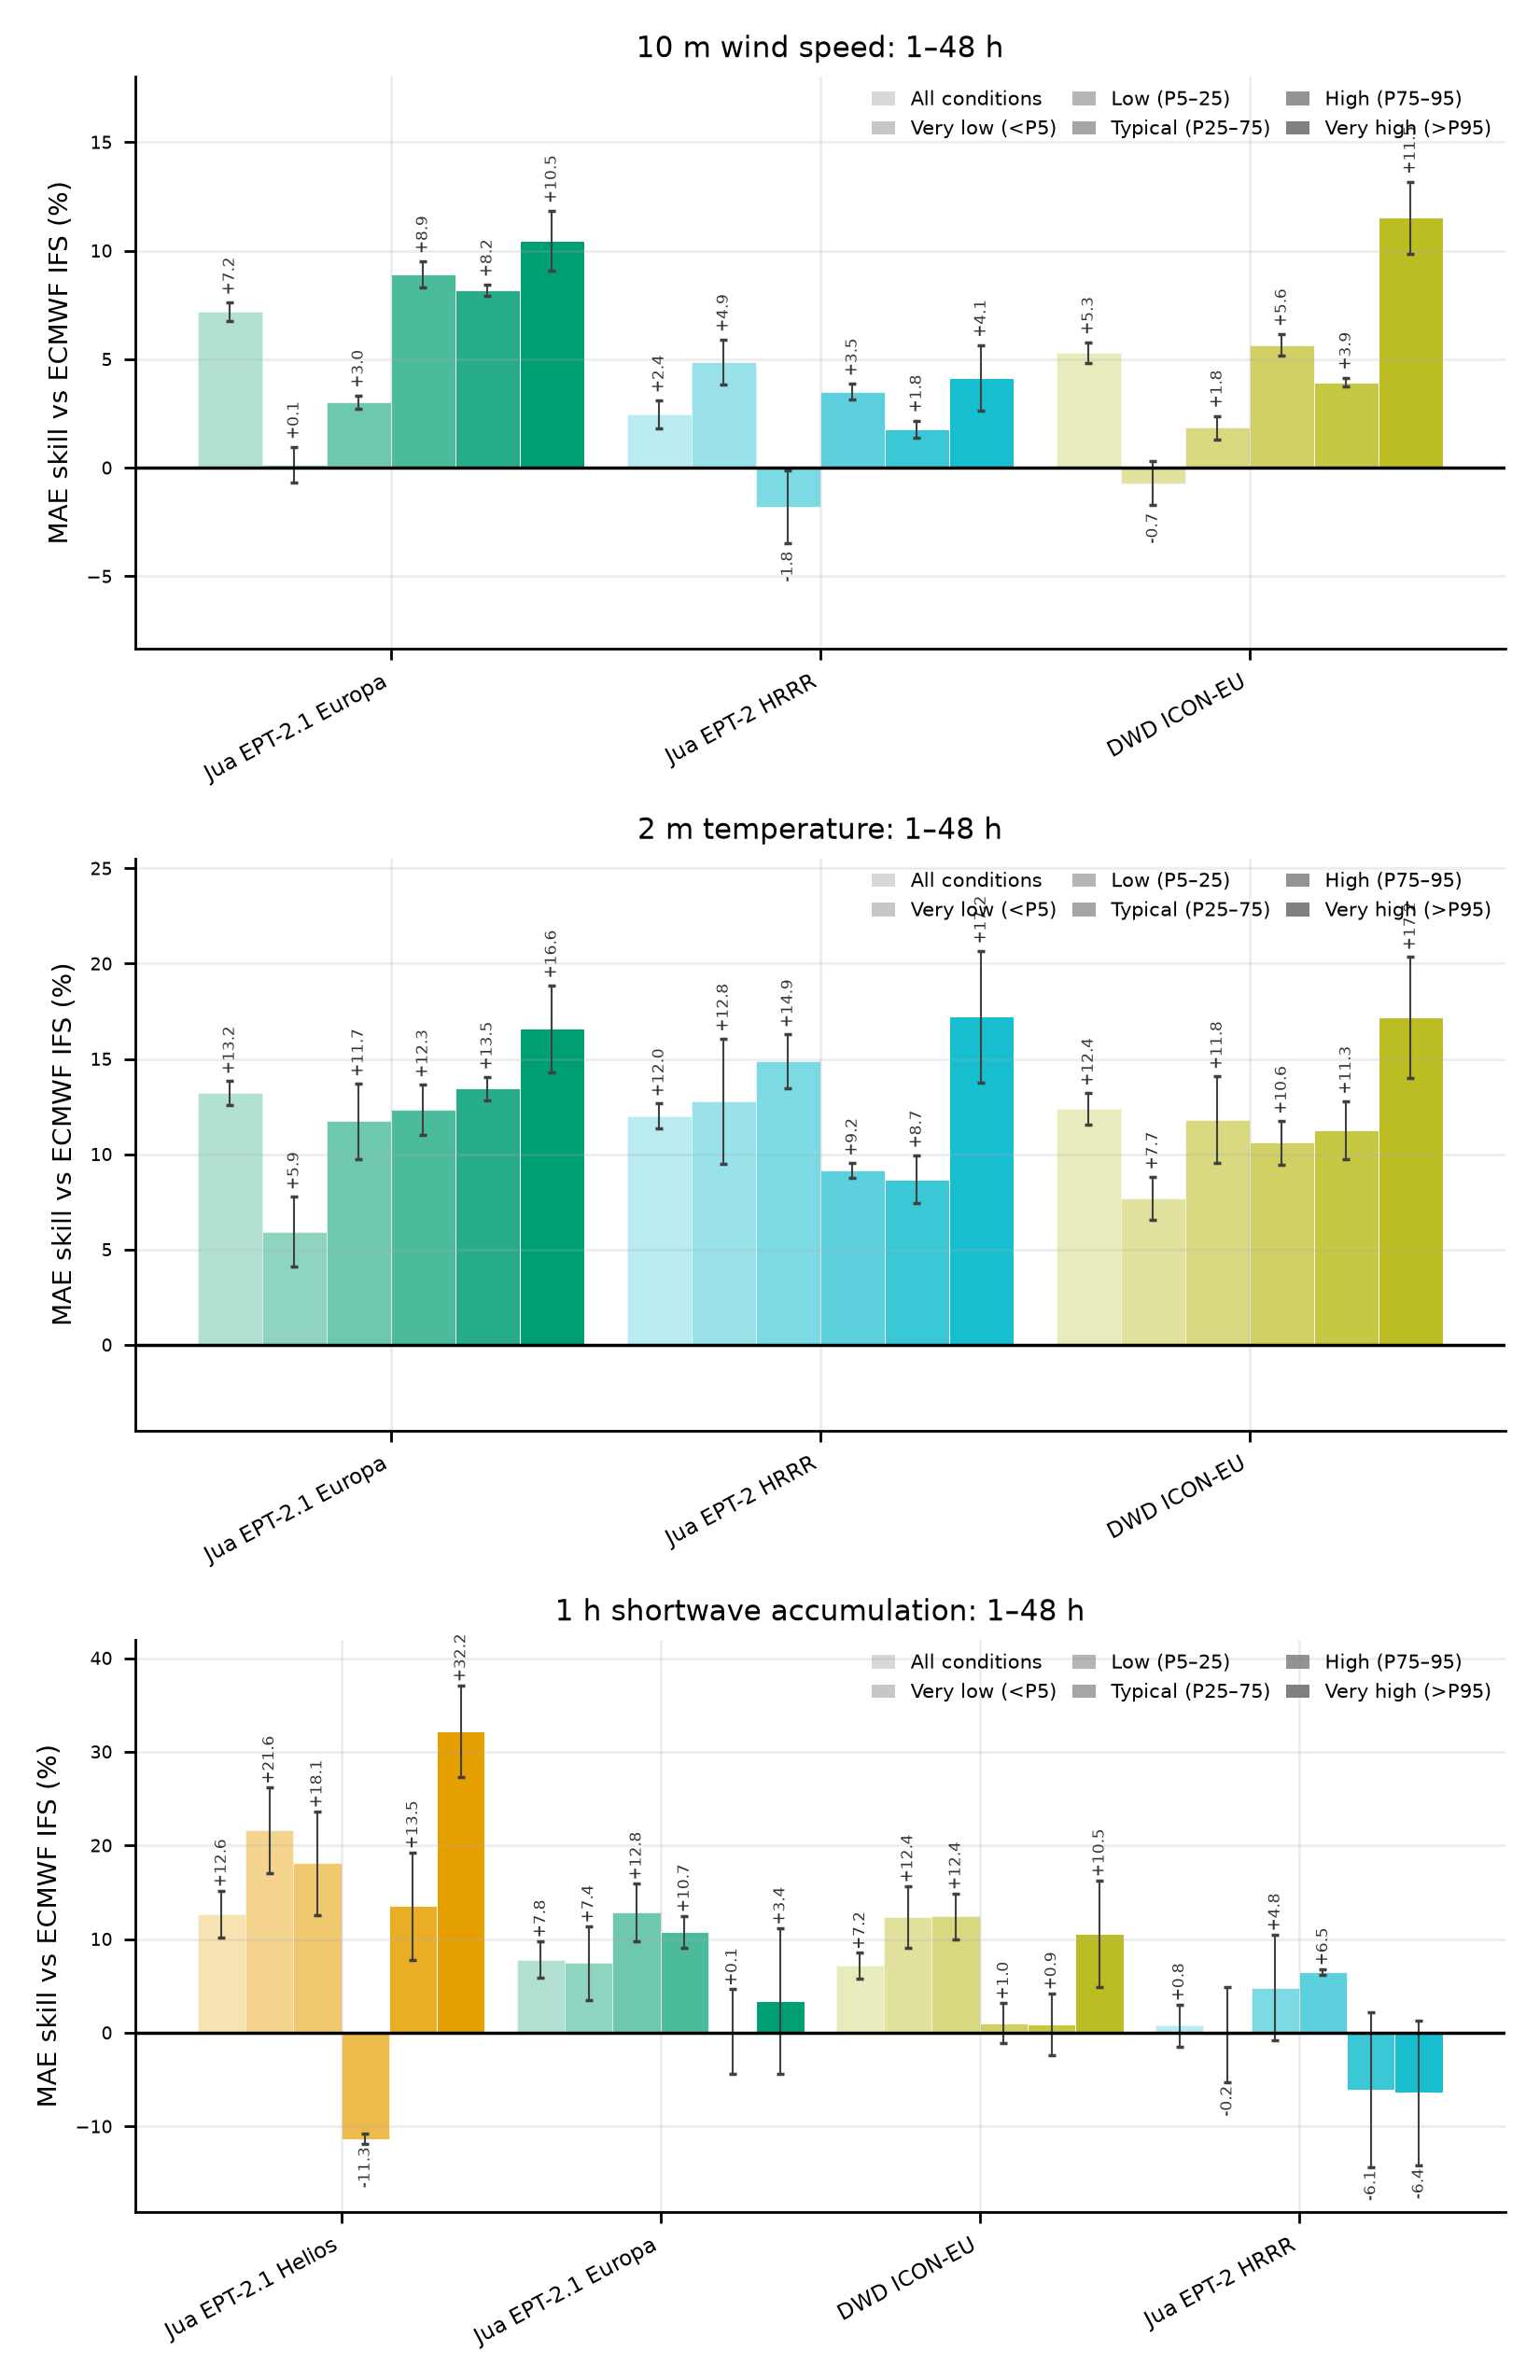
The March–June regional comparison. EPT-2.1 Europa leads wind overall, the AI systems and ICON-EU are closely matched in extreme wind and temperature, and EPT-2.1 Helios leads solar.
EPT-2 HRRR is the only regional system that remains positive from light through high precipitation.
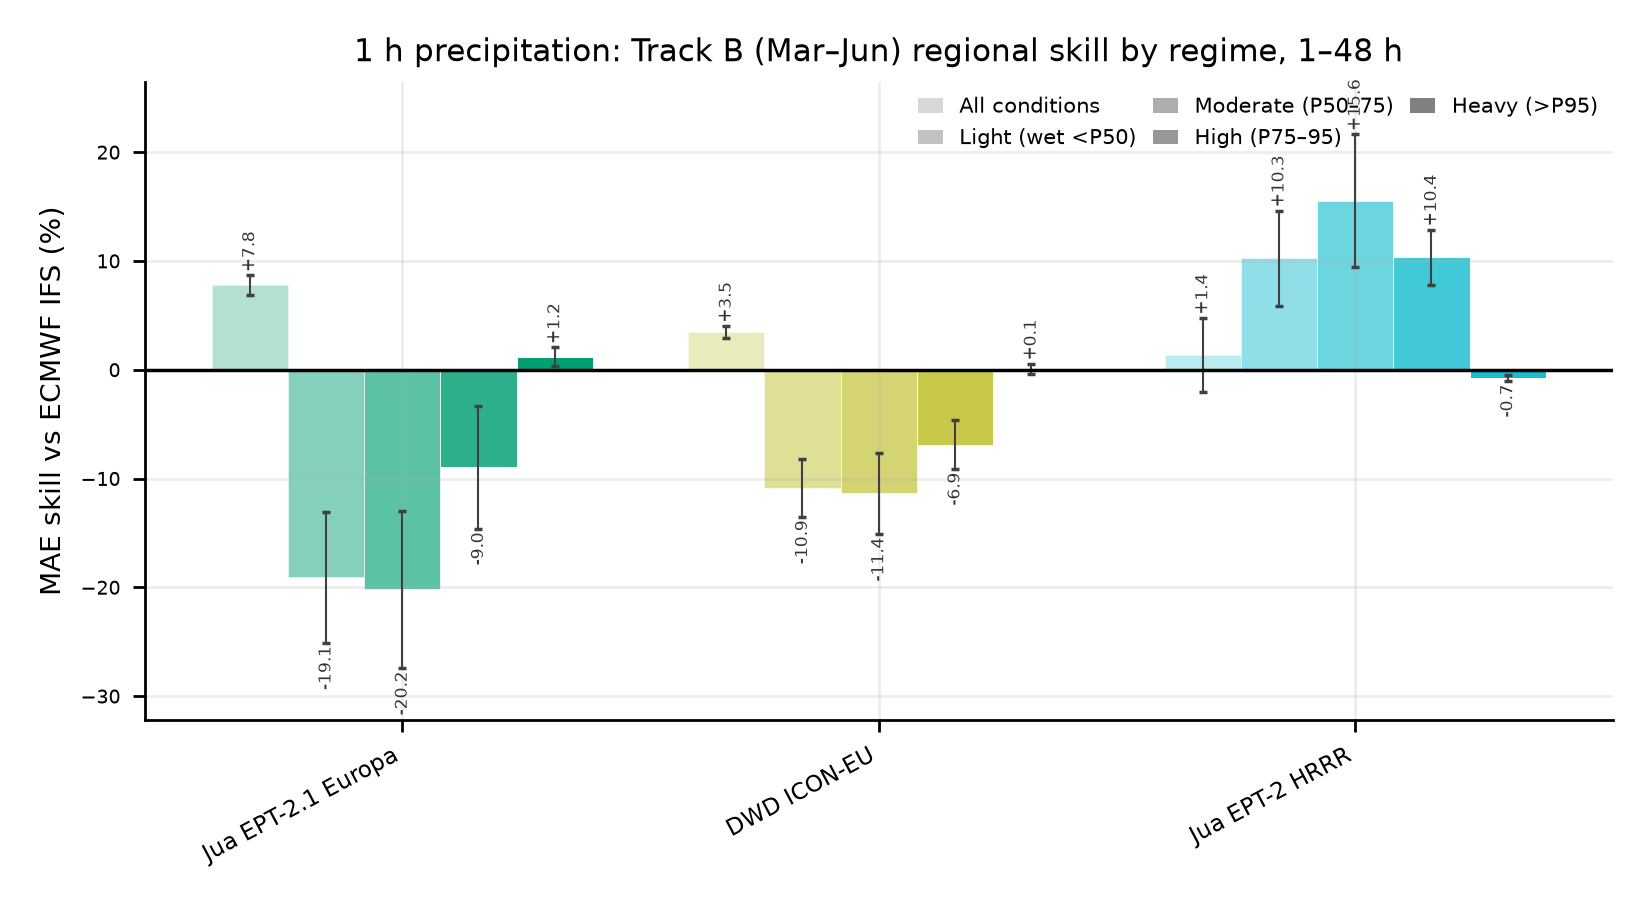
Regional precipitation skill against IFS. EPT-2 HRRR leads from light through high rain and reaches +15.6% in moderate precipitation.
Country profiles reproduce the same broad ordering across Europe. NOAA GFS's deficit in the highest-temperature conditions appears across the countries with sufficient data. EPT-2.1 Europa and ICON-EU remain among the strongest wind and temperature systems across most profiles.
The ordering cuts across AI and physical approaches. The individual model matters more than its category.
What changes now
The evidence replaces the broad question—“Can AI weather models handle extremes?”—with a practical one: which model performs best for this variable, region, forecast horizon, and observed condition?
Physics-based models no longer hold an automatic advantage when conditions move into the tails. Modern AI systems can lead there. The shared pull toward average conditions remains an open problem across model families.
This changes how weather models should be evaluated and selected. Model selection now requires both average scores and performance in the extreme conditions that drive the decision.
Reproduce everything
The aggregate data behind the explorer and every score-based paper figure, table, and quoted value are reproducible from the public AI weather extremes repository.
Read the paper on arXiv, inspect the methods and figure-generation code, or download the aggregate JSON directly from the explorer.