Most traders we work with start their day the same way. Open the platform, scan the latest model runs, check which ones moved overnight, figure out where the consensus sits and where it doesn't. Repeat for every market zone in the portfolio.
It takes longer than it should before any actual trading decisions get made. And it's the same work, every morning.
Morning Briefings is the feature we built to give that time back.
What it does
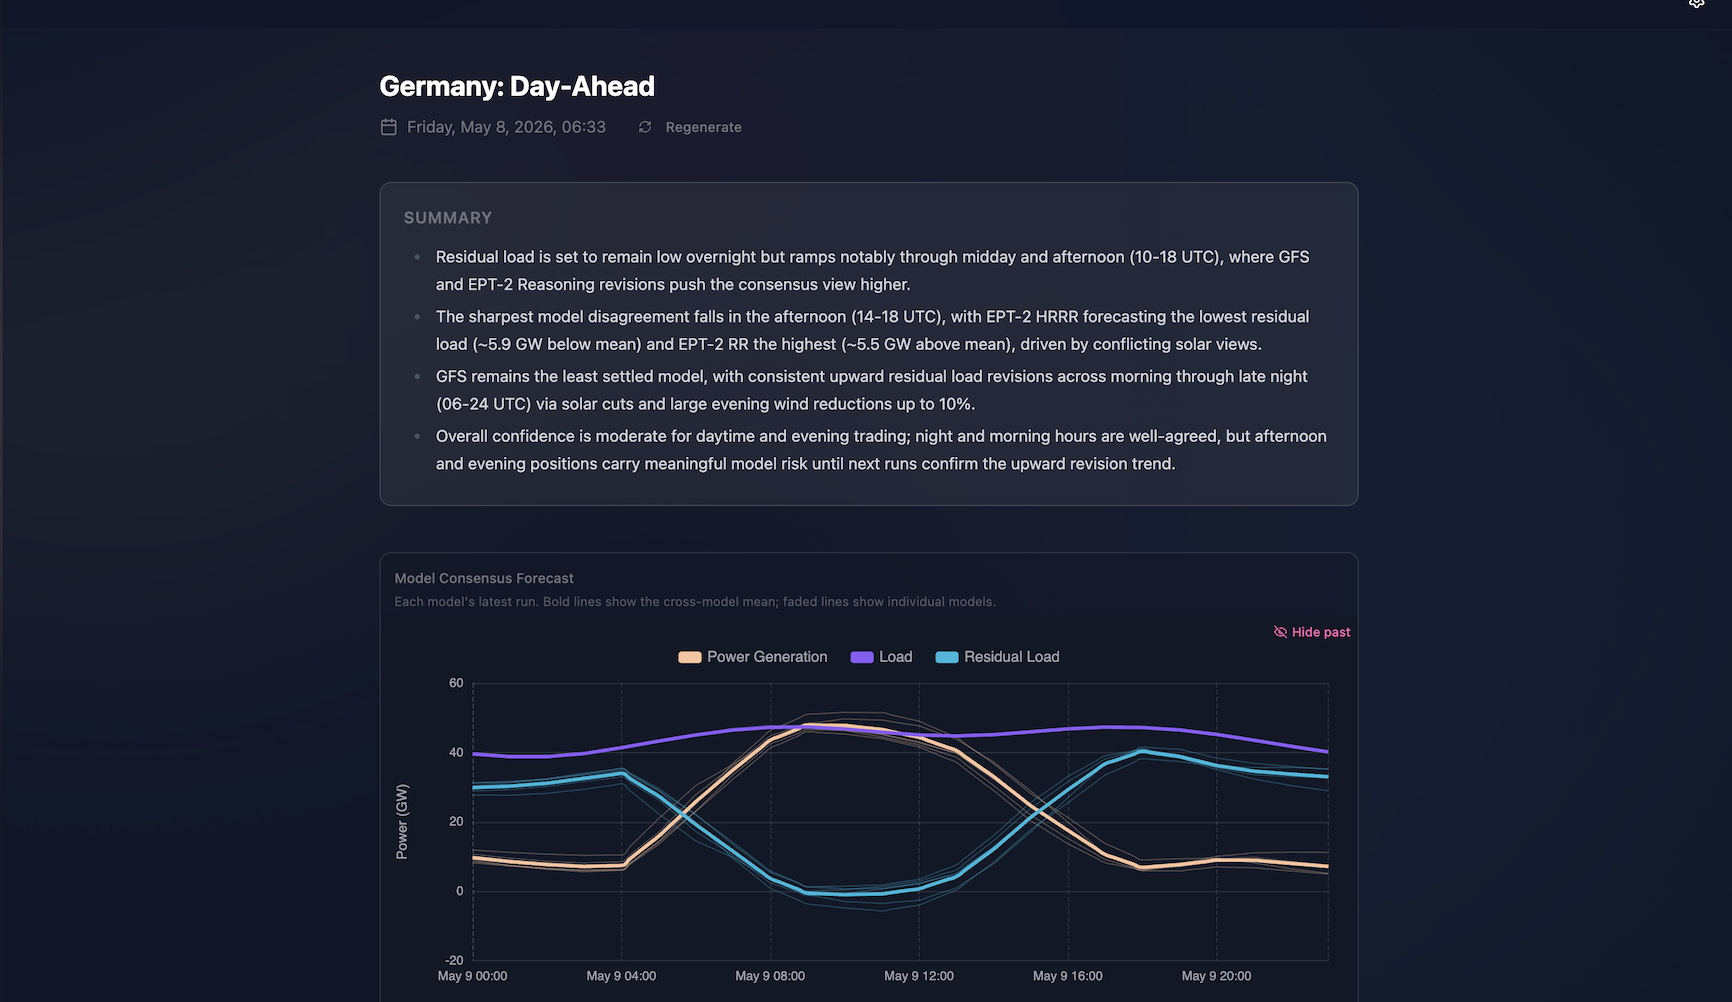
A Morning Briefing is a per-zone summary of the trading day, generated automatically every morning.
Each briefing shows you four things: where the models agree on the day ahead, where they don't, how the forecast has shifted since yesterday, and how yesterday's forecasts compared to what actually happened. You get this for power generation, load, and residual load, across every market zone we cover.
The point is that by the time you sit down, the synthesis is already done.
The briefing is yours to configure. You pick which models you want in the analysis, the ones you think actually move the market for this zone, and ignore the rest. And you're not locked into the morning run either: you can regenerate the briefing at any point in the day to pull in the latest runs from each model.
Where the models agree and disagree
A briefing starts with a written summary of the day. Which hours the models agree on. Which they disagree on. Where forecast confidence is high and where the risk sits.
Below the summary is the consensus plot. Thick lines show the consensus across all models for power generation, load, and residual load. Thin hairlines show each individual model's forecast.
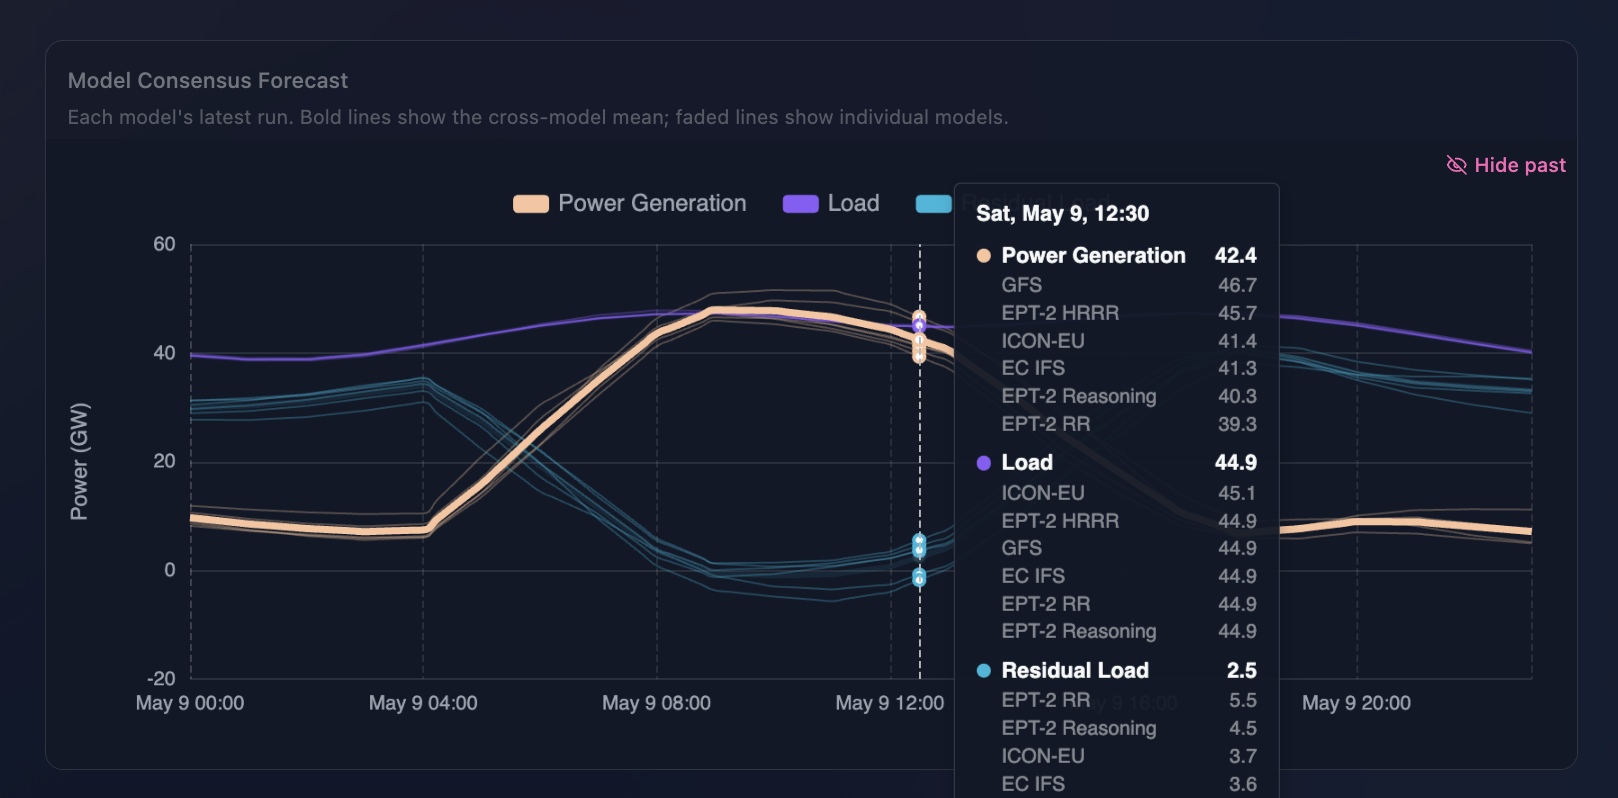
The spread is the part that matters. Where the hairlines bunch tightly, the day is largely settled. Where they fan out, that's where the risk lives, and where to focus.
Which models are running high or low
Then we flip the same data into a delta view. The plot shows each model's forecast as the difference from the consensus mean, with 15-minute resolution. You see which models are running high and which are running low without having to read individual lines off the consensus plot.
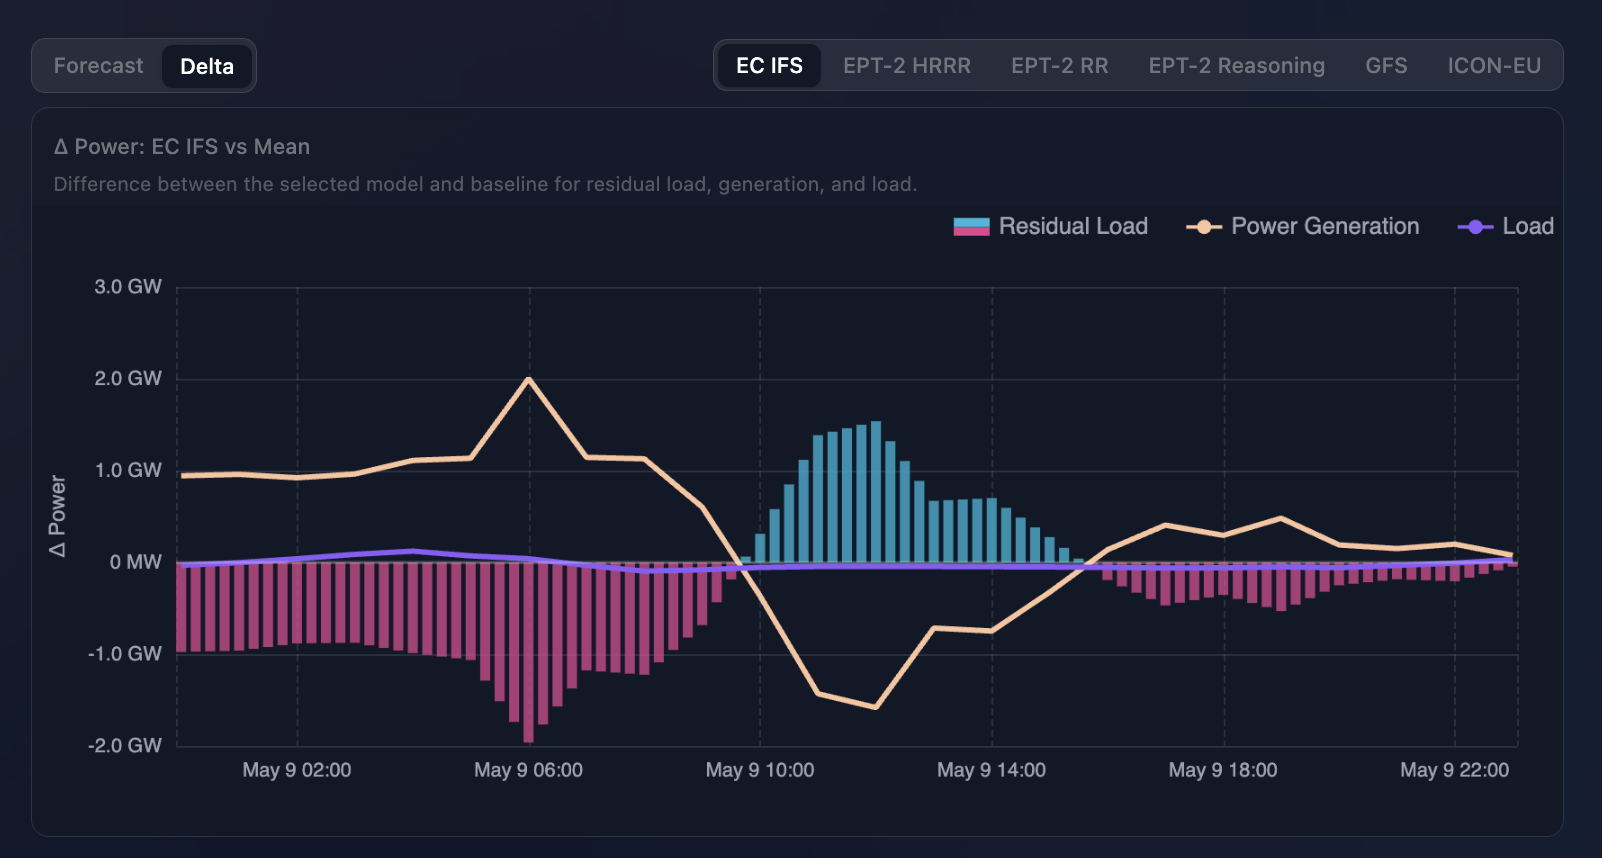
The baseline is configurable. You can compare against the consensus mean, against IFS, or against any specific model you trade against.
How each forecast has moved run over run
The latest run is only the latest guess. Six hours ago, the same model may have been telling a different story, and that drift is often where the signal is. The convergence view shows how each model has evolved over its last four runs: 18 hours ago, 12 hours ago, 6 hours ago, and the latest.
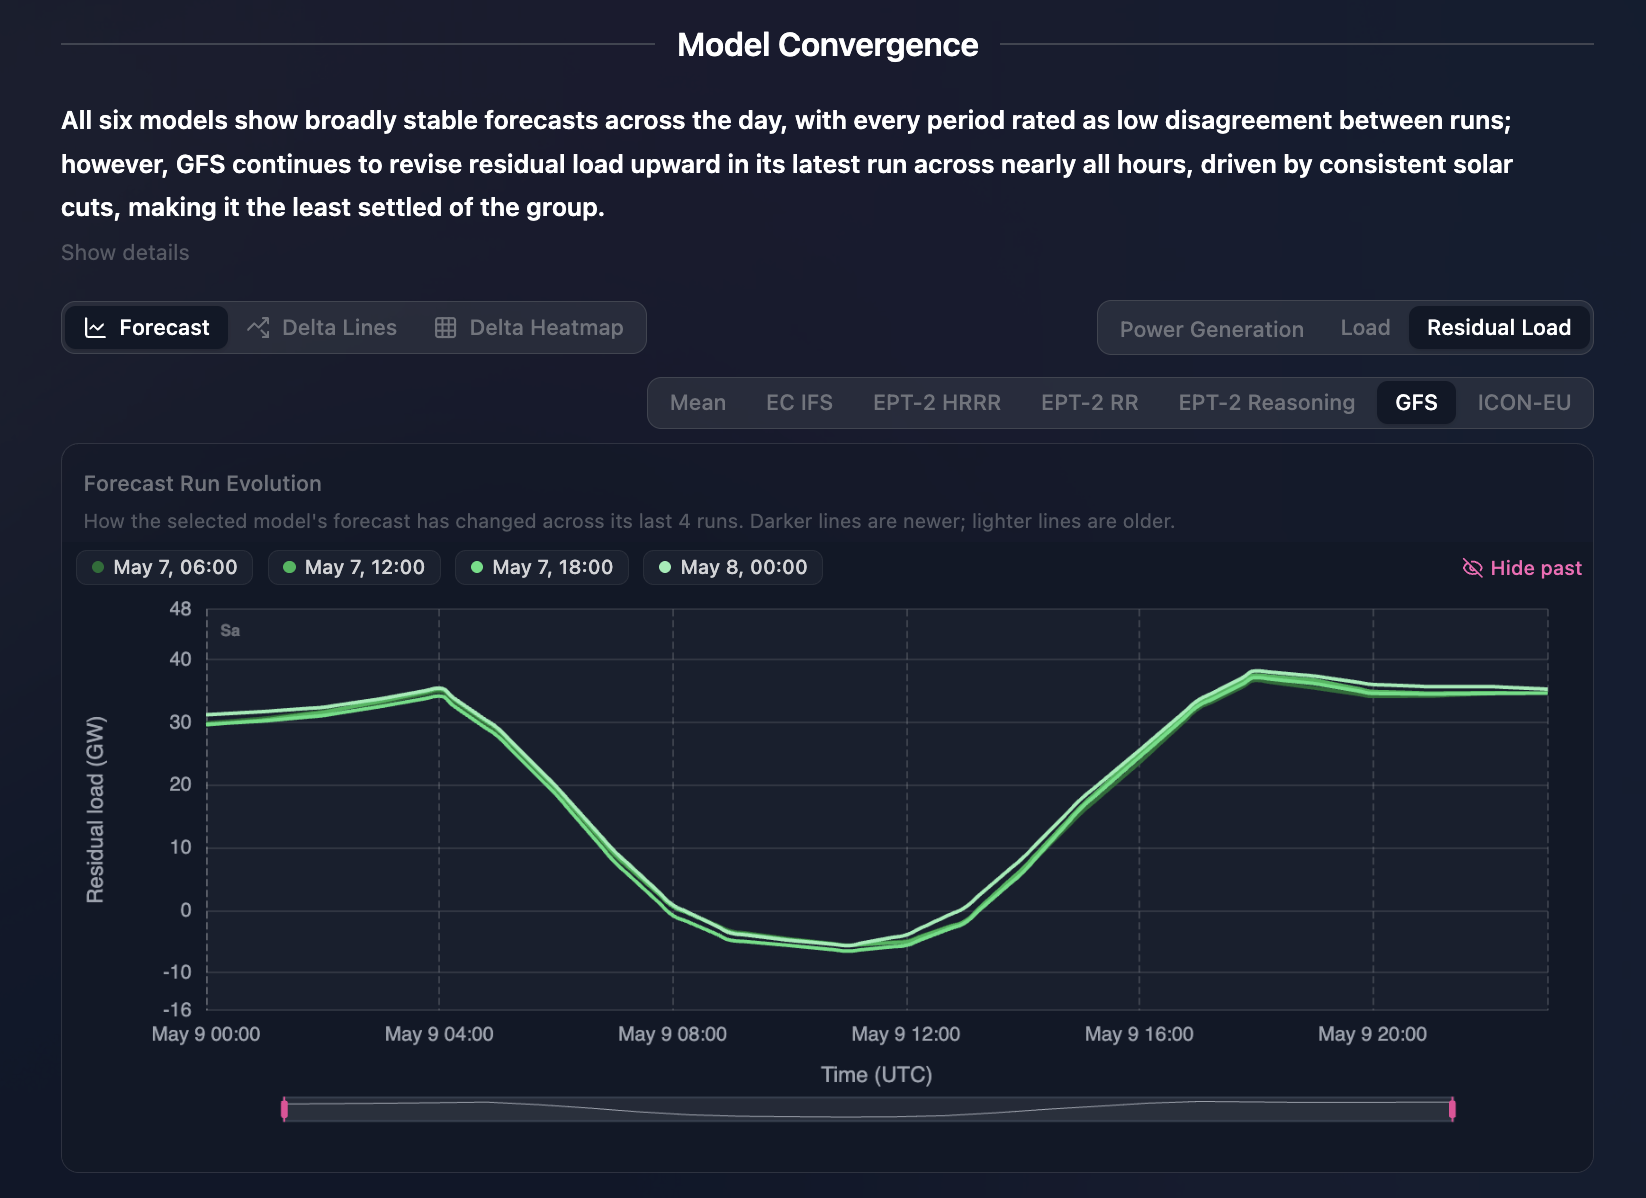
You can view this for power generation, load, residual load, or individual renewable production like wind. You can also drill into a single model and watch its trajectory across consecutive runs. That kind of intra-run drift is invisible if you're only looking at the latest forecast.
Which models called yesterday right
The last section compares what each model forecast for the previous day against what actually happened, with day-ahead prices that resolved for yesterday plotted just below.
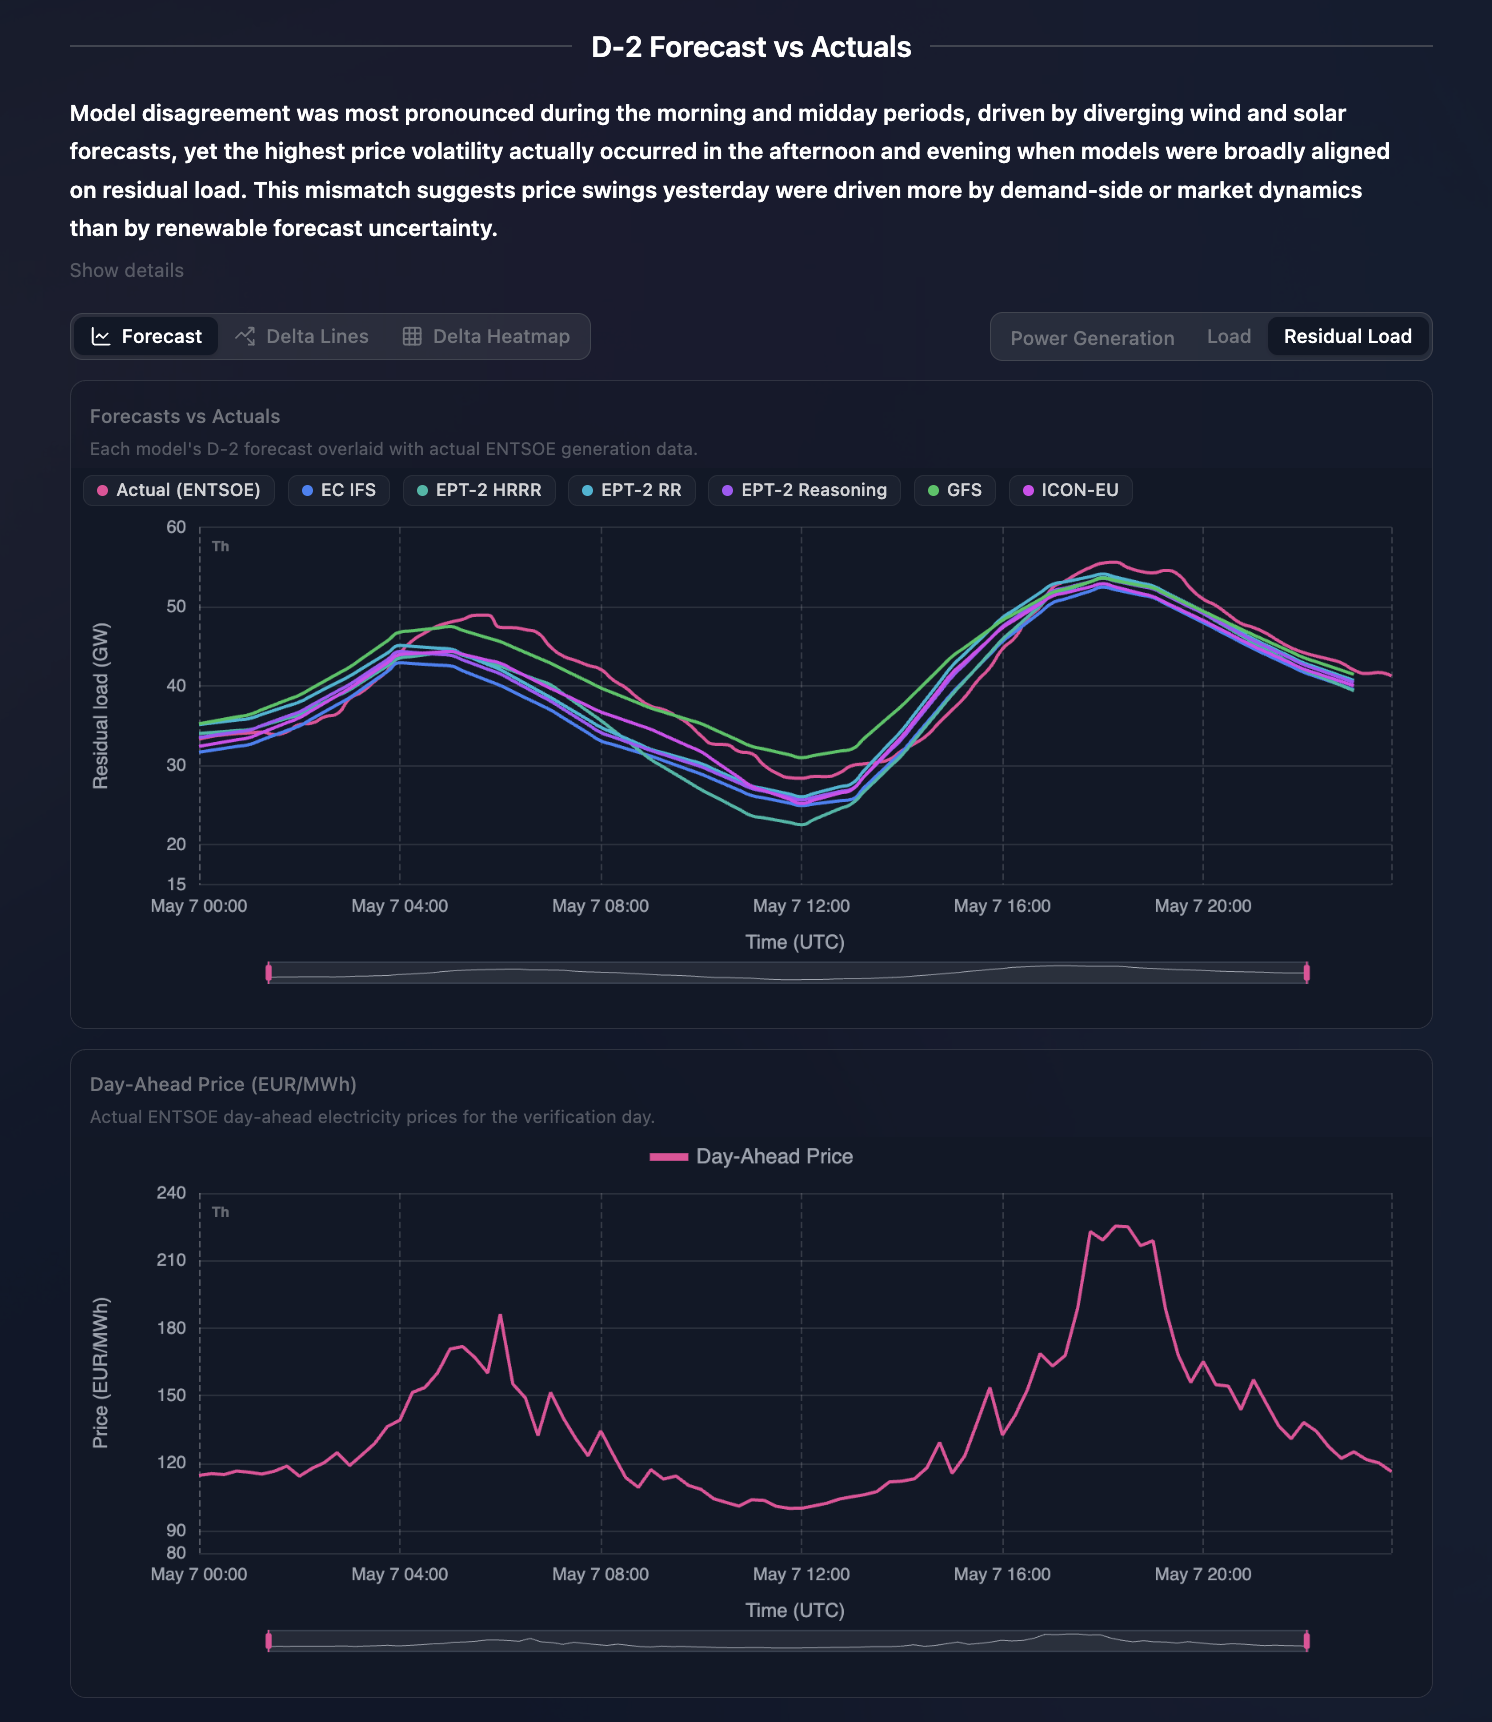
It's the part traders use to build a track record on the models. Which one was right yesterday, in this zone, under conditions like these. Over weeks of briefings, that's what calibrates intuition.
Why this matters
The start of a trading day is some of the most valuable time a trader has. Morning Briefings don't replace the judgment that goes into that time. They remove the assembly work that gets in front of it.
You open the platform, pick a zone, and the picture is already there. Where the risk is. Where the models agree. What yesterday's call looked like.
Morning Briefings are live now across most European zones in the Jua platform.
Niels Poulsen